Price corrections are natural, but knowing where they may pause is what separates strategy from guesswork. Fibonacci retracement settings help you measure pullbacks and identify logical price zones, which aid in planning the trade. In this blog, we will simplify Fibonacci retracement settings for practical use.
What are Fibonacci Retracement Settings?
Fibonacci retracement settings are technical tools that are used to identify the resistance and support levels during market pullbacks. The retracement settings are percentage levels derived from the Fibonacci sequence, where each number is a sum of the preceding two.
The idea is simple: after a strong price move, the market retraces a portion of the move before continuing in the original direction.
Rather than trying to guess where the retracement will stop, Fibonacci helps in identifying structured price zones, where the buyers or sellers re-enter the market.
Best Fibonacci Retracement settings
The best Fibonacci retracement settings depend on your trading style and market conditions.
However, most traders focus on major levels: 23.6%, 38.2%, 50%, and 61.8%.
These levels are sufficient to identify the pullback zones. Adding too many extra ratios can clutter the chart and create confusion.
Advanced traders sometimes add extra levels like 127.2% and 161.8% to set profit targets. The key is consistency. Once you have chosen Fibonacci settings, stick with them and test them across different market conditions.
Which Fib levels to keep?
There are different Fibonacci levels, each serving a unique purpose.
- 23.6% – This is considered a shallow retracement and reflects a minor correction. It is usually seen in very strong trends and is useful for aggressive trades.
- 38.2% – A Fib level of 38.2% indicates a moderate level of retracement. This level is said to be healthy in trending markets and is useful to identify support and resistance zones.
- 50% – It is not a Fibonacci ratio mathematically, but widely respected because it represents the midpoint where buying and selling pressure is equal.
- 61.8% – Also known as the Golden Ratio, a retracement level of 61.8% is closely watched by traders because many reversals occur here.
- 78.6% – It is the last line of defence before a full trend reversal takes place. It is also called the Final Retracement for this reason.
- 100% – 100% Fib means the price has returned to the level where it stood prior to the move. This level marks a major decision point for traders.
Is 0.5 a Fibonacci level?
Technically, 0.5 or 50% is not a Fibonacci ratio because it does not directly come from the Fibonacci sequence. However, this level is used by traders because markets often retrace halfway back before resuming the trend.
This concept existed long before Fibonacci tools became popular. Over time, Fib level 0.5 became popular because it aligned well with market psychology. It reflects an equilibrium where both buyers and sellers are in equal control.
Even though it is not mathematically a Fibonacci percentage, 0.5 is one of the most respected and used retracement levels.
Optional levels: when to add 0.786 vs 0.886
Some Fibonacci levels are optional, meaning they are not essential for every trading setup but can be included depending on your strategy. These additional levels are generally used in price action trading for a deeper analysis of pullbacks and reversal zones.
- 0.786: The full retracement level of 0.786 or 7.86% is derived from the square root of 61.8%. It represents a deep pullback where the price has corrected strongly, but the broader market structure still supports continuation. It acts as a final retracement before the price bounces back or goes through a full reversal.
- 0.886: This is even a step further than the previous level and is taken from the square root of 0.786. It is not commonly required for taking regular trades. The 88.6% level is typically reserved for complex pattern-based strategies.
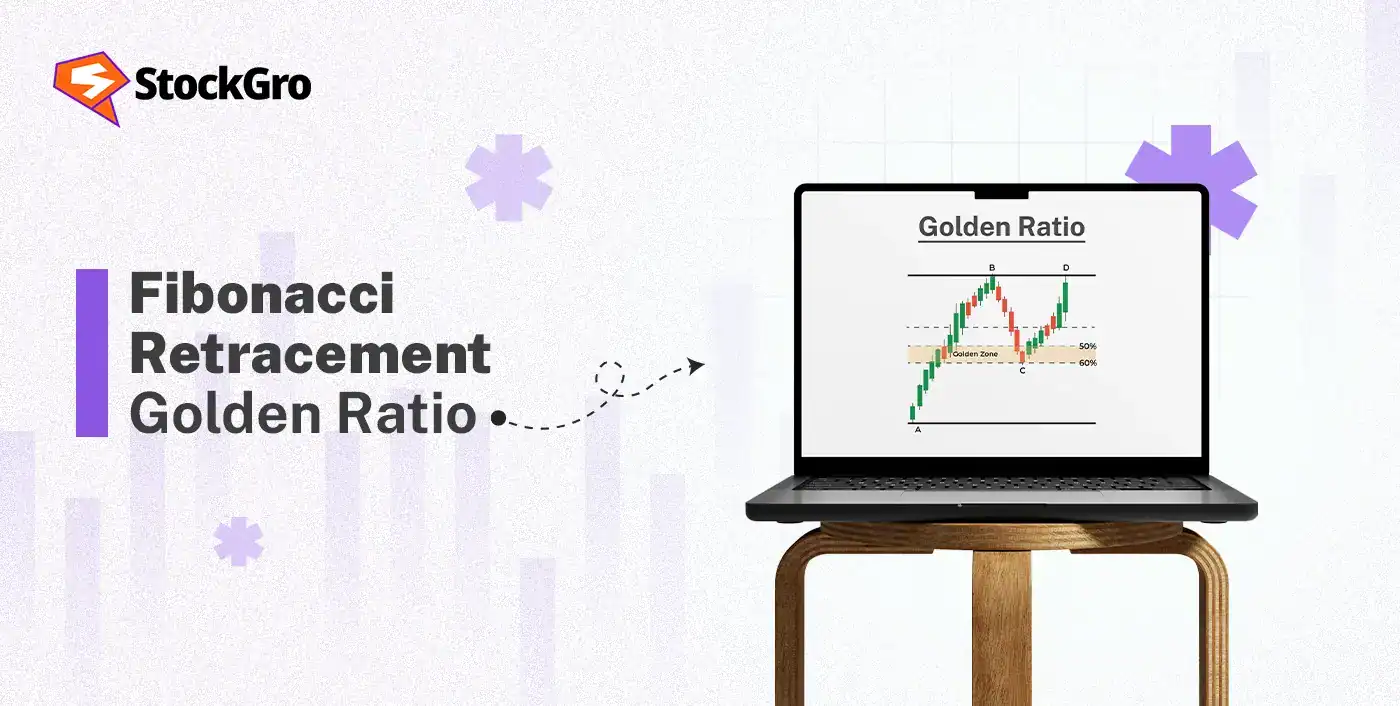
Golden Zone settings (50–61.8) vs full-level settings
Golden Zone settings and full-level settings represent two different approaches to using Fibonacci retracement.
Golden Zone (50–61.8)
The Golden Zone is the area between 50% and the Golden Ratio at 61.8%. It represents a balanced correction within a trend. Many use this setting as it filters out minor pullbacks and helps in focusing only on the major retracements.
The Golden Zone has cleaner charts, which makes entries and placing stop-losses easier in high-profile zones.
Full-Level Settings
These include all major Fibonacci levels such as 23.6%, 38.2%, 50%, 61.8%, and 78.6%, providing a broader view of potential retracement areas.
They are useful for evaluating the price structure in detail and use shallow as well as deep retracements before making a decision.
How to draw Fib correctly
Drawing Fibonacci retracement correctly is as important as the levels themselves. Even the best settings will not work properly if the swing points are selected incorrectly.
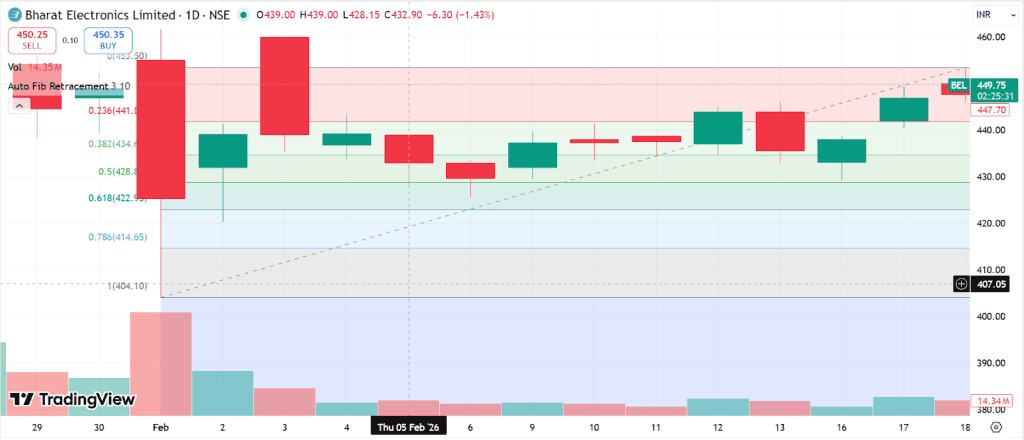
• Uptrend: swing low → swing high
Follow these steps when drawing Fib in an uptrend:
- Start by identifying the swing low form where the price began moving upward.
- Locate the most recent swing high that formed before the pullback began.
- Ensure that the move between the swing low and high reflects a strong upward trend.
- Finally, draw the Fibonacci retracement tool from the swing low to the swing high.
A Fibonacci retracement in an uptrend is visible on Bharat Electronics Limited’s chart between February 1 and February 18, 2026.
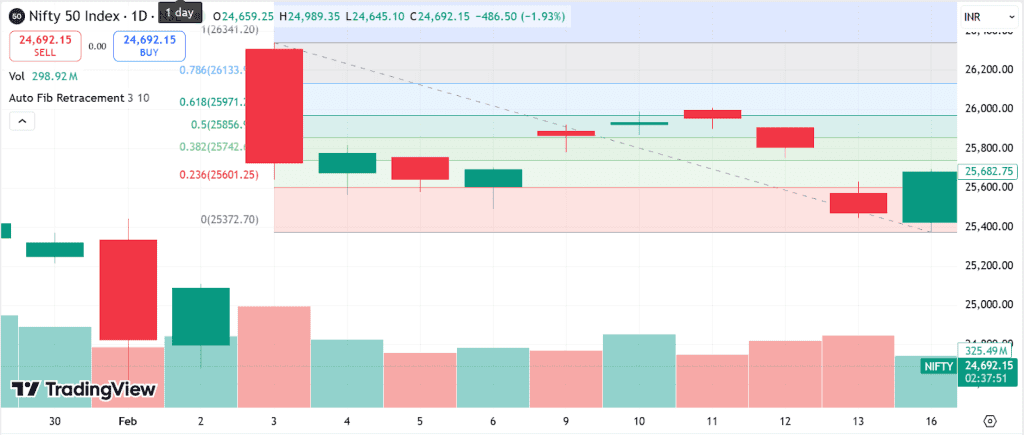
• Downtrend: swing high → swing low
In a downtrend, take the given approach to draw the Fib:
- First, identify a clear swing high from where the price started moving downward.
- Next, locate the recent swing low that formed before the temporary upward bounce.
- Confirm that the move between the swing high and low represents a strong downward trend.
- Finally, draw the Fibonacci retracement tool from the swing high to the swing low.
A Fibonacci retracement in a downward trend is seen on the Nifty 50 chart between February 3 and February 16, 2026.
Wicks vs candle bodies: what to use (and when)
When drawing a Fibonacci retracement, traders often wonder whether to use the extreme wick or the candle body.
- Using wicks:
When you draw Fibonacci using wicks, it means you’re capturing the highest high and lowest low of the price move.
This method captures the market’s full volatility, making it useful for unstable conditions where the price frequently tests extreme levels before reversing. - Using candle bodies:
Candlestick bodies only focus on the opening and closing prices. When Fibonacci is drawn with them, it results in a smoother structure without sudden spikes.
Candle bodies work well in trending markets with steady price movement.
There is no universally correct method. The better approach is to observe how your market or asset behaves and remain consistent with one method for accuracy.
Conclusion
Fibonacci retracement settings are measurement tools that add structure to pullbacks. By focusing on key areas, you can identify major support and resistance levels, which helps in setting up the trade. Keeping the charts free of clutter provides clarity and improves decision-making.
When used with discipline and in the right market conditions, Fibonacci retracement settings can bring consistency to trading results.
FAQs
The most commonly used Fibonacci retracement levels are 23.6%, 38.2%, 50%, 61.8%, and 78.6%. However, many traders mainly focus on 38.2%, 50%, and 61.8% as they often provide clearer pullback zones.
Most traders on TradingView use the default settings: 0%, 23.6%, 38.2%, 50%, 61.8%, 78.6%, and 100%. Some also add 127.2% and 161.8% extensions for setting profit targets.
No, it is not a Fibonacci retracement level because it is not derived from the Fibonacci sequence. However, it is widely used because markets often retrace half of a move before continuing.
In an uptrend, draw a Fibonacci from the most recent swing low to swing high. In a downtrend, draw from swing high to swing low. Always choose clear, visible price swings for better accuracy.
Both methods are valid depending on market conditions. Use wicks in volatile markets to capture full price extremes, and candle bodies in smoother trends where closing prices provide better structural clarity.
The Golden Zone refers to the 50%–61.8% retracement area. It is widely considered a high-probability zone where price often resumes the prevailing trend after a healthy and balanced pullback.