When it comes to spotting reliable trading opportunities, chart patterns do play a crucial role. Among these, the Flag and Pole pattern does stand out as the most favourite among traders for its effectiveness and simplicity.
This particular pattern helps in predicting the continuation of the existing trend after taking a brief pause or consolidation.
In this blog, we are about to explore what the Flag and Pole pattern is, the different types, how it forms, and the possible ways to trade it successfully.
What is a Flag and Pole Pattern?
The Flag and Pole pattern is a continuation chart which indicates strong price trend, where pole is a sharp rise in price and the flag moves price sideways. It holds onto two main parts:
- The pole represents a strong and sudden shift in pricing.
- The flag is a slight retracement or short period of consolidation that moves counter to the pole.
This particular pattern looks like a flag as present on a flagpole, denoting its name occurrence. Traders look for this setup to predict exactly when the price can resume the initial strong move.
How the Flag and Pole Pattern Works?
A powerful and potentially directional market move (the pole) is shown by the Flag and Pole pattern, which is followed by a small and usually short-lived pause (the flag). This technical analysis pause lets traders hold their breath and the market to consolidate.
Once the price tends to break out of the flag in the direction of the initial pole, then it signals a likely continuation of the trend. This pole strength chart pattern reflects the momentum, while the flag represents a temporary and healthy correction happening before the trend resumes.
How the Flag and Pole Pattern Forms
The formation involved two different phases:
- Pole Formation: A rapid price drop or surge that happens out of strong selling or bullying pressure. A vertical pole appears on the chart as a result of this abrupt change.
- Flag Formation: After the pole, the price moves into a consolidation phase, usually a slight retracement or tight range. The flag further tends to slope against the prior trend, yet remains within a channel or rectangle.
After that, the price will confirm the pattern by breaking out of the flag back in the same trend.
Types of Flag and Pole Patterns
Flag and Pole pattern come in two main types based on the direction of the trend:
- Bullish Flag and Pole
- The pole is a steep upward move.
- The flag is a small downward or sideways channel.
- The breakout happens over the flag’s upper boundary level, signaling possible uptrend continuation.
- Bearish Flag and Pole
- The pole is a sharp downward move.
- When prices briefly consolidate upwards or laterally, it’s called a flag.
- If the breakout occurs below the flag’s lower boundary, it could mean that the downturn will continue.
Both these types signal traders when the momentum is likely to resume, post the brief pause.
How to Identify a Valid Flag and Pole
- To spot a valid Flag and Pole pattern, start looking for a strong and nearly vertical price move, which ultimately turns out to be the pole. It shows strong momentum, which could be bullish or bearish, and a distinct trend.
- Next, observe the flag, which must form into a rectangle or well-defined channel. This consolidation area slopes slightly against the pole direction, exhibiting a brief pause or correction rather than a full reversal.
- The flag duration typically remains short, either lasting for a few weeks or a few days. An indication of declining momentum or a new pattern could be a lengthier consolidation.
- The most important confirmation comes when the price closes definitely beyond the flag’s boundary in the original pole direction. This breakout confirms the trend to begin again.
- Check for increased volume on the breakout. Higher volume typically adds up strength to the signal and even reduces false breakout chances.
Traders can confidently follow these steps to identify reliable Flag and Pole pattern to make effective and informed trading decisions.
How to Trade Using Flag and Pole Pattern
Entry and Exit Points
- Entry: Traders take a position in the first pole direction from the flag’s boundary as the price breaks down. It’s a break above the flag for bullish flags, and break below for bearish flags.
- Exit: Targets are set by measuring the pole height and breakout points are used to project the exit. In order to define a reasonable profit goal, this predicted move is useful.
Stop Loss and Target Placement
- Stop Loss: Place stops just beyond the flag’s opposite side to protect against false breakouts. The bottom and top of a bullish and bearish flag, respectively, are visible here.
- Profit Target: The target needs to be set using the pole length as projected from the breakout. From it, one can derive a worthwhile risk-reward ratio.
Risk Management Tips for Flag Trading
- Never enter trades before witnessing the breakout confirmation.
By patiently waiting for a definite breakthrough, you can lessen the likelihood of being caught up in false signals. Premature entries can end up in potential losses if the price reverses back into the flag.
- Always use stop losses to limit risk.
Stop losses help protect your capital by automatically exiting losing trades. In the event that the breakout fails or reverses for some reason, they aid in limiting losses.
- Breakouts may not succeed if trade volume is minimal.
In most cases, low volume breakouts are weak and easily reversible.Trading only on strong volume breakouts increases the chance of success.
- Combine flag pattern trades with other indicators or volume confirmation for better success.
Indicators like as relative strength indexes (RSIs) and moving averages can bolster your analysis and validate the strength of the trend. This multi-tool approach helps filter out weak signals.
- Adjusting position size given your risk tolerance.
You should never risk more money in a single deal than you can afford to lose. Good position sizing helps you manage the risk of your whole portfolio appropriately and keeps you from trading based on your feelings.
Common Mistakes to Avoid
- Volume Ignorance: Low volume on breakout most often leads to false signals.
Volume confirms the breakout strength; ignoring it will increase the chance of being trapped in fake moves. Keep an eye out for a spike in volume as confirmation of the pattern.
- Early entries: Jumping in way before a confirmed breakout can increase risk.
Making early entries might seem favorable at first, but it often results in stop-outs if the price returns within the flag. Patience does play a crucial role in avoiding such unnecessary losses.
- Misidentifying consolidation: Every lateral shift is not necessarily a flag. Flags do have a unique shape and slope; mistaking other consolidations for flags can only mislead your trades. Ensure to understand and study the pattern carefully before making decisions.
- Using in sideways markets: Flag patterns perform the best in strong trending markets.
A flag pattern could cause an erroneous breakout in a flat or choppy market. It is more advantageous to trade them when a clear trend is present prior to the flag.
- Neglecting stop losses: Skipping stops can lead to bigger losses on false breakouts.
Without stop losses, a failed breakout can lead to significant breakdowns. Always preserve capital and protect your trades with a well-placed stop loss.
Flag Pattern vs Pennant Pattern
| Feature | Flag Pattern | Pennant Pattern |
| Shape | Rectangle or parallel channel | Small symmetrical triangle |
| Flagpole Length | Long and sharp price move | Similar as flag but usually shorter |
| Consolidation Shape | Rectangular or sloping channel | Converging trendlines |
| Breakout Direction | Similar as the pole | Similar as the pole |
| Duration of Pattern | Longer consolidation period | Shorter consolidation |
| Typical Use | Continuation pattern | Continuation pattern |
Both patterns signal trend continuation, but flags do have rectangular consolidations, while pennants have converging triangles.
Real Chart Examples of Flag and Pole Pattern
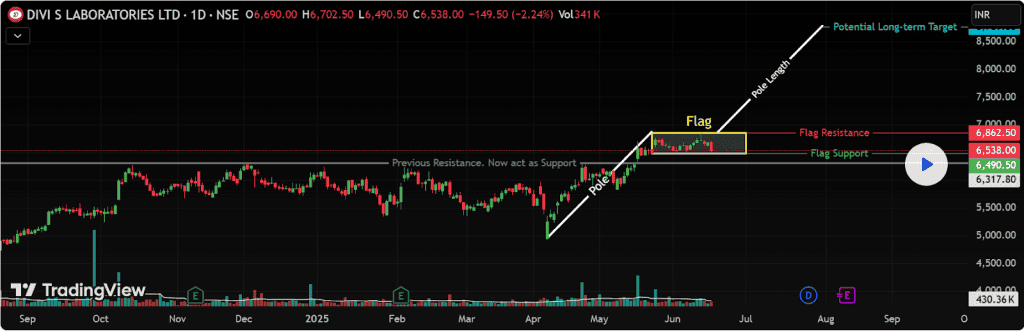
A traditional flag and pole arrangement is depicted on the DIVISLAB chart. Tight consolidation occurs between ₹6,490 and ₹6,800 followed by the pole which extends from ₹4,955 to ₹6,862. Interim stops might be placed at ₹7,200 and ₹7,600, with ₹8,769 as a potential target for a breakout over ₹6,862 (ATH). At ₹6,300, you can find support, and a daily close over ₹6,880-₹6,900 with good volume would be perfect for an entry. Overvaluation above ₹7,600 could cause profit-booking; however, sector strength and earnings growth maintain the structure. Placing a stop loss order at ₹6,700 controls the risk.
Conclusion
The Flag and Pole pattern is a straightforward yet effective tool for traders who wish to ride and follow strong trends. Identifying this type of pattern allows prediction of trend continuation after a good pause, and strategic entry and exit with explicit risk management. Knowing how it forms, types, and the right trading strategies, traders can leverage this pattern to enhance timing and achieve profitability. Always make sure to pair it with volume and other indicators to get a better result.
FAQs
The Flag and Pole pattern is one way to look at a chart and predict whether a trend will last. The pattern’s defining features are first, a spike in price action (the pole), and then, second, a consolidation or narrow range retracement phase (the flag). This pattern looks like a flag on a pole and signals that, after the halt, the price has a greater chance of moving in the same direction. This pattern is a popular practice among traders to estimate clear entry and exit points.
To identify the pattern, look for a nearly vertical and sharp price move called the pole. Next, analyse the short consolidation phase where the price either moves sideways or against the trend, forming a rectangle or small channel, named the flag. The pattern will be confirmed when the price, on heavy volume, bursts out past the flag’s boundary and heads in the opposite direction of the pole. A good indicator of the likely price change is the height of the pole.
If the uptrend resumes after a short break, it is a bullish flag pattern. A small retracement or temporary consolidation is represented by the flag, whereas a fast price surge is indicated by the pole. After the price crosses above the upper edge of the flag, it signifies fresh buying momentum and interest. For traders, this is a green light to go long, with the expectation that prices will climb by the length of the pole.
While a downtrend is underway, a bearish flag pattern could emerge, signalling that the trend will keep going downhill. A flag indicates a consolidation or little upward channel following a pole, which is a precipitous decline in price. Resumption of selling pressure is imminent upon a breach below the flag’s lower barrier. When an upswing is underway, a bullish flag will form with a prominent upward pole and a flag that leans slightly to the side or downwards just before the price breaks out higher.
Yes, the Flag and Pole pattern is highly effective for both intraday and swing trading. On intraday charts, it helps in spotting quick trend continuations without a trading session. For the swing trader, it highlights short-term pauses even before the main trend resumes. It is critical, however, to have proper risk management and volume confirmation without having false breakouts that can happen easily in these fast-moving intraday markets.