When price doesn’t move up or down, even slightly, it forms the four price doji. It’s one of the quietest candlestick patterns, showing total balance between buyers and sellers. While easy to miss, it stands out because of how rare it is. In this blog, we explain how this pattern forms and what traders usually think when they see it.
What is a Four Price Doji?

A four price doji is a rare candlestick pattern where the open, high, low, and close prices are all the same. It appears as a flat horizontal line on the chart. This pattern usually forms during extremely low activity in the market, usually outside regular trading hours and reflects a pause in buying and selling.
How is the Four Price Doji Formed?
The pattern forms when the open, high, low, and close prices are all equal within a single candle’s timeframe. This results in a flat line on the chart with no visible body or wicks. It usually occurs in extremely quiet conditions where trading activity is minimal. Such situations can arise in illiquid assets, limited participation periods, or ultra-short timeframes where no price change happens during the entire duration of the candle.
What Does a Four Price Doji Indicate?
This pattern shows that buyers and sellers have made no progress in either direction during the time period being viewed. Since there is no visible body or wicks, it reflects a complete standstill in price movement. This often points to a quiet market phase, possibly just before or after a major move, or during periods with little trading activity. It may also appear in charts of illiquid assets or during short time frames, but does not, by itself, suggest any upcoming price movement.
How to Identify a Four Price Doji on a Chart
The main features that help identify a four price doji are discussed below:
- Shape: It appears as a single horizontal line without any vertical shadows since the open, high, low, and close are all the same.
- Extended trading hours: These often show up during pre-market or after-hours sessions when very few trades occur, leading to flat price action.
- Short time frames: They are more common on 1-minute or 5-minute charts, where minimal price change over a short period can result in such a pattern.
- Illiquid securities: They also appear in lightly traded assets like penny stocks, where transactions are infrequent.
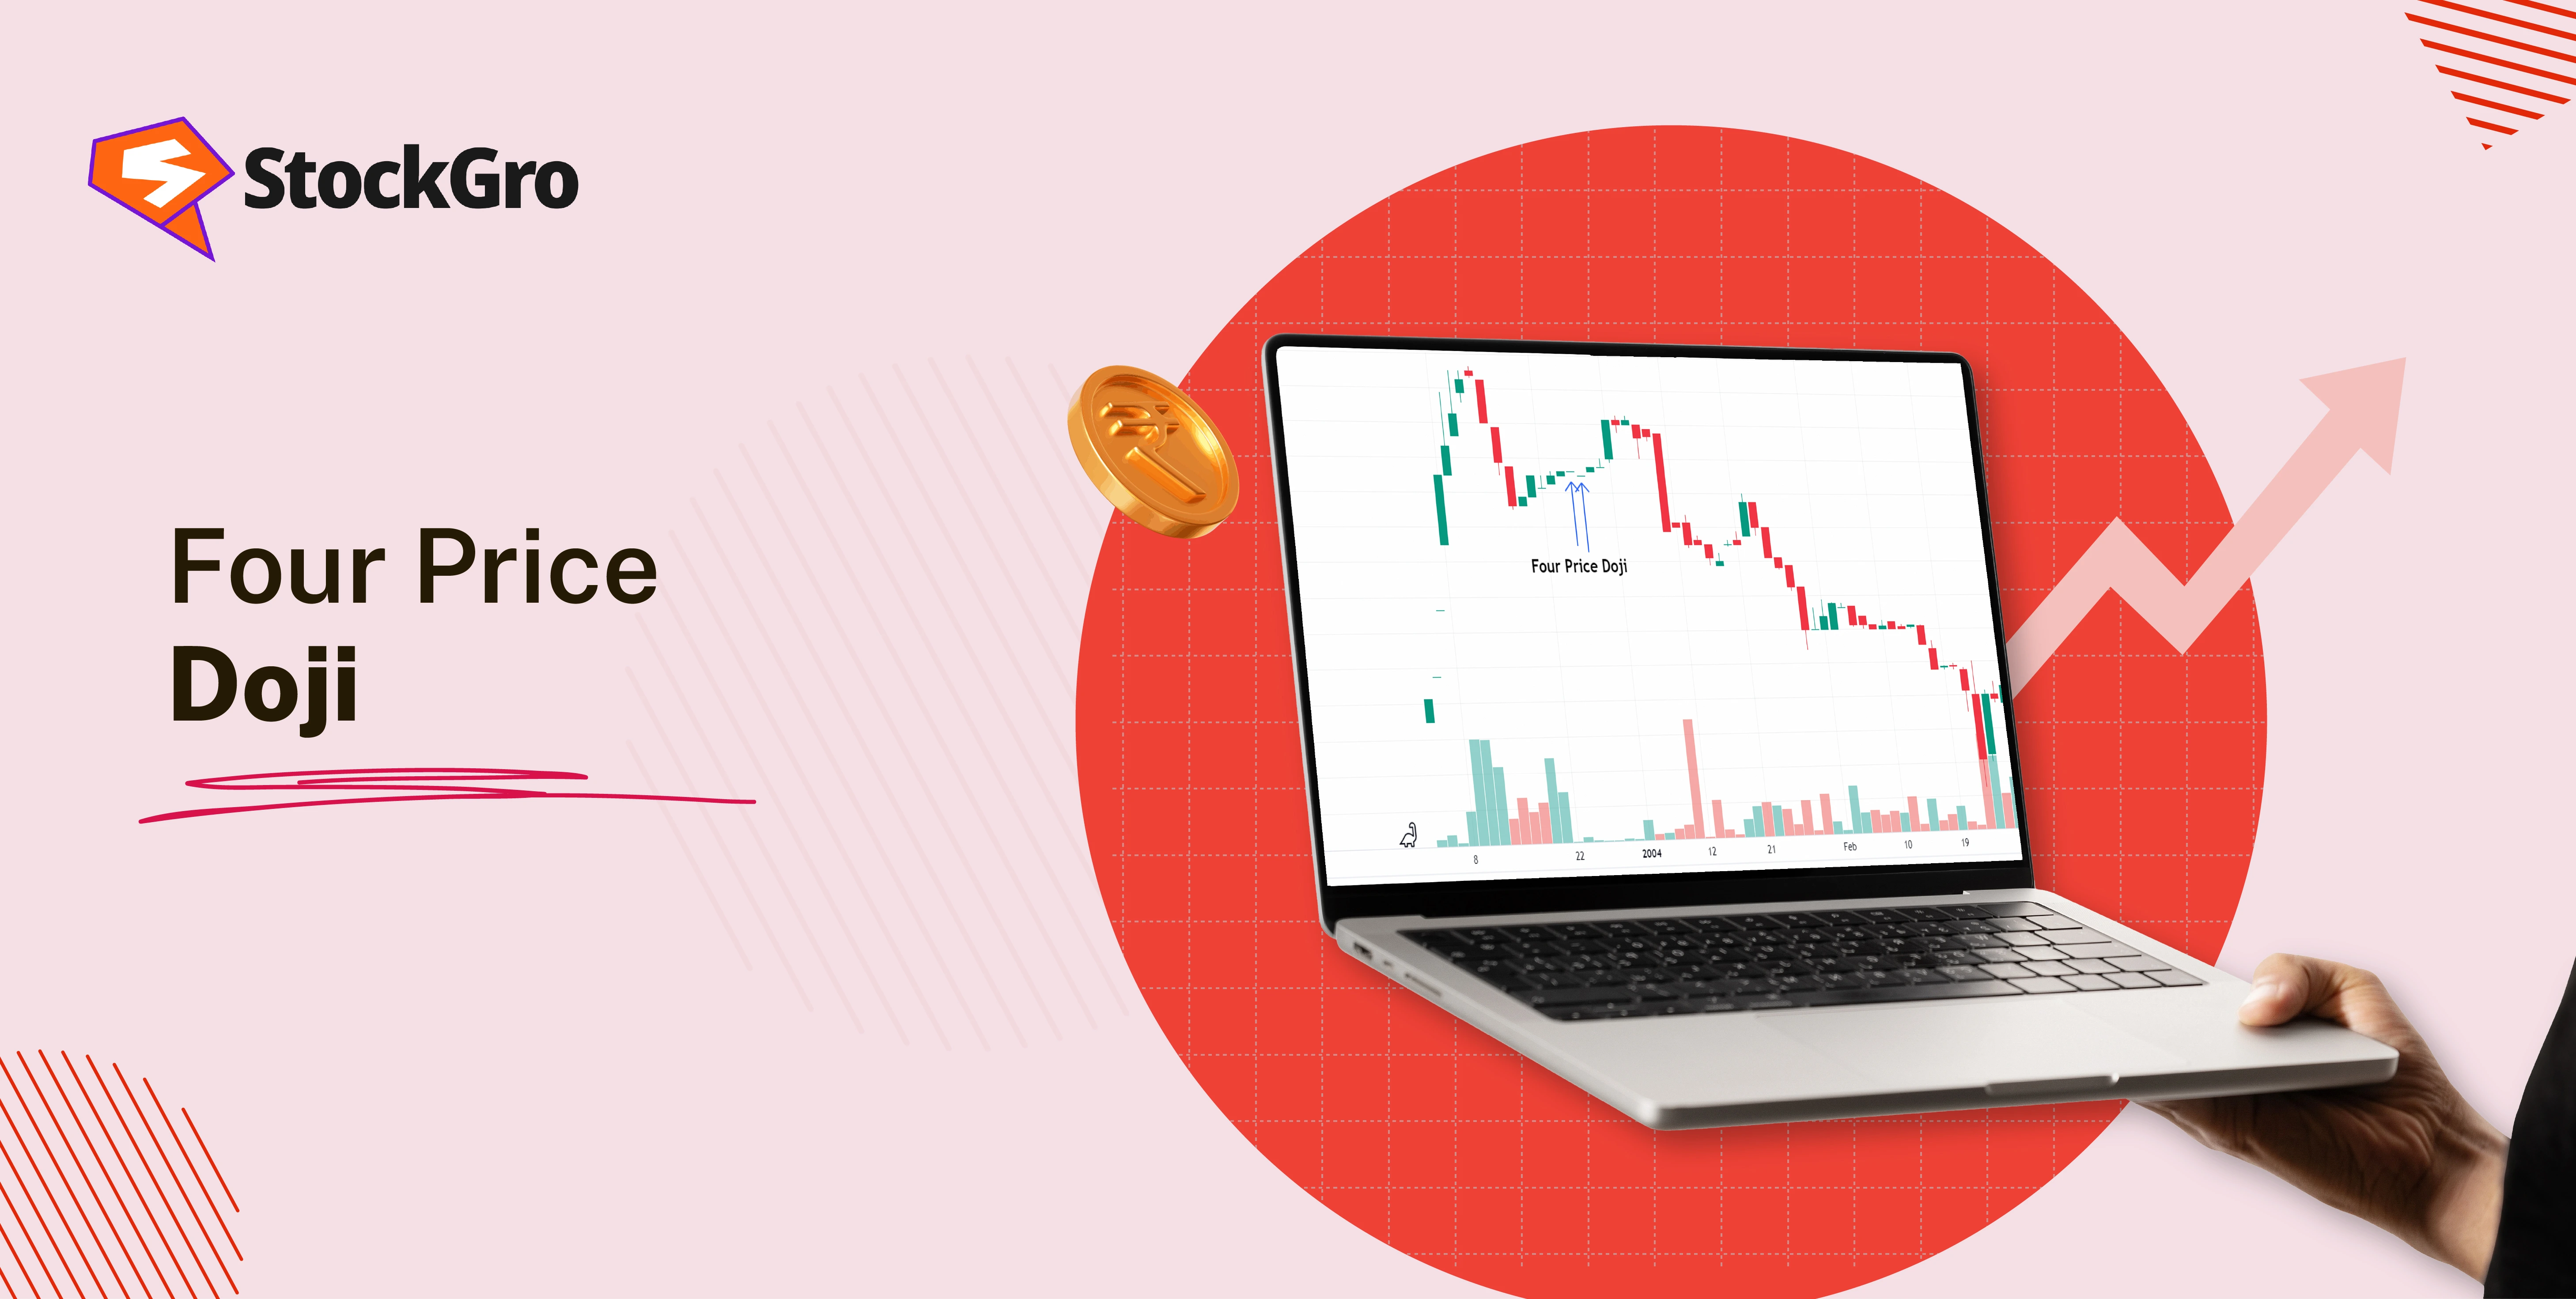
Let’s take an example of Blue Coast Hotels Limited, the Four Price Doji on its daily chart for July 11, 2025, shows more than just a pause. It repeats on nearby days and points to how inactive the stock is, so few trades happen that the price stays unchanged from open to close.

Characteristics of the Four Price Doji
The main characteristics of the four price doji have been discussed below:
- Identical price points: All four prices (open, high, low, close) are the same, producing a clean flat mark on the chart.
- Appears during inactivity: Typically shows up when there’s a pause in participation, often outside peak trading periods.
- Low-volume assets: Seen more often in instruments that are thinly traded throughout the day.
- Absence of price fluctuation: No visible price range is present during the candle’s time frame.
- Integrated use: Gains more relevance when appearing as part of larger candlestick formations.
- Technically unique: Rare among common patterns due to its flat shape and lack of price movement.
Where Does the Four Price Doji Typically Appear?
The Four Price Doji usually shows up in charts where price remains completely inactive during a specific time frame. It tends to appear in assets that see little to no participation during certain intervals, such as micro-cap stocks or lightly traded ETFs. It may also occur when there’s a brief pause due to market events or pending news, leading to a freeze in price action. These appearances are often short-lived and isolated.
How to Trade Using the Four Price Doji Pattern
These are the steps to follow when using this pattern as part of your trading setup:
Step 1: Entry: Use the pattern only when it appears as part of a broader setup. For bullish trades, spot it after a down move with other reversal signs; for bearish trades, look after an up move with bearish confirmation.
Step 2: Take Profit: Plan your exit based on price levels like support or resistance, or using tools such as Fibonacci retracement or moving averages that align with your strategy’s target area for a potential price reaction.
Step 3: Stop Loss: Place your stop-loss where the trade idea becomes invalid. You can use the nearest key level, indicator-based zones, or a distance that maintains a balanced risk-to-reward ratio based on your strategy.
Is the Four Price Doji Reliable?
On its own, the Four Price Doji offers limited insight because it reflects inactivity, not directional pressure. Its reliability increases only when used in larger chart structures or with supporting data such as volume or previous candles. In active markets, it’s unlikely to appear or hold significance. Most often, it’s treated as a neutral observation rather than a standalone signal.
Advantages of the Four Price Doji
The main advantages of the four price doji have been listed below:
- Easy to recognise on charts due to its unique flat shape.
- Helps flag low-activity periods where prices remain unchanged.
- Supports larger candlestick setups when used in combination.
- Useful in identifying possible stalling zones during quiet sessions.
- Can assist traders in filtering noise in intraday timeframes.
- More visible in short-duration charts, aiding quick observation.
- Highlights specific areas with reduced market interest.
- Often appears in illiquid assets, helping assess participation.
- Offers clarity for learners exploring candlestick basics.
- Useful as a neutral marker for non-directional market behavior.
Limitations of the Four Price Doji
Despite of its many benefits, the pattern also has some drawbacks to be aware of:
- Rarely seen in highly liquid or active instruments.
- Provides no direction or price bias when seen alone.
- Often caused by low activity, not by market forces.
- May be misread as meaningful when it’s just inactivity.
- Has little significance without volume or surrounding setup.
- Can appear due to technical halts or data delays.
- Not useful for planning entries or exits independently.
- May show up frequently in thin markets, diluting its relevance.
- Difficult to apply in swift environments or volatile charts.
- Often adds minimal value when isolated from broader patterns.
Four Price Doji vs Other Doji Patterns
Doji candlesticks appear when price opens and closes at nearly the same point, but their shapes vary based on the session’s price range. The four price doji appears unique with no visible body or shadows, making it one of the flattest patterns on a chart. To understand its structure better, let’s take a look at how it compares to other forms of doji patterns.
- Four Price Doji vs Standard Doji
The standard doji has a narrow body with slight price movement, unlike the flat structure of the four price doji. Here’s how they differ:
| Feature | Four price doji | Standard doji |
| Open, high, low, close | All are exactly the same | Open and Close are same; High and Low differ |
| Appearance | Flat horizontal line | Thin cross-like shape |
| Visibility | Very rare and hard to spot | Common and often seen |
| Price Activity | No price movement at all | Some movement above and below close |
- Four Price Doji vs Long-Legged
Marked by extreme intraday swings, the long-legged doji covers far more ground during the session than the completely inactive four price doji. Here’s a closer look at how the two candles stand apart from each other:
| Feature | Four price doji | Long-legged doji |
| Shadows | No upper or lower shadows | Very long upper and lower shadows |
| Body | Non-existent | Very small, nearly invisible |
| Price behavior | No movement throughout the session | Wide price swings during the session |
| Use on chart | Shows pause in activity | Suggests sharp pull in both directions |
- Doji Four Price Doji vs Dragonfly Doji
While the dragonfly doji hints at a full downward move and recovery, the four price doji records nothing beyond a flat, fixed level. Here’s how the two forms vary:
| Feature | Four price doji | Dragonfly doji |
| Shadow type | No shadows | Long lower shadow only |
| Opening & closing | All prices are identical | Open, high, and close are the same |
| Shape | Flat line | ‘T’ shaped |
| Common zone found | Any time in chart | Often after a price dip |
- Four Price Doji vs Gravestone Doji
Gravestone doji displays a rise followed by a sharp pullback, the other remains motionless throughout. This table maps their core differences:
| Feature | Four price doji | Gravestone doji |
| Shadow direction | None | Long upper shadow only |
| Shape | Flat horizontal line | Inverted ‘T’ shape |
| Price activity | No movement recorded | Price rose and then dropped |
| Typical location | Varies | Often appears after a rise |
Conclusion
The four price doji is more than just a flat line on the chart, it shows a session where price stayed exactly the same from start to finish. Though often overlooked, its unique shape marks periods when very little activity takes place. While not commonly used on its own, understanding where and why this pattern appears adds depth to candlestick reading, especially when seen alongside broader chart setups or during low-participation phases.
FAQs
A four price doji appears as a short horizontal line on a candlestick chart, where the open, high, low, and close prices are all the same. It strongly signals market indecision, showing no clear movement by buyers or sellers during that period.
The four price doji is neutral and neither bullish nor bearish on its own. It shows complete balance in the market, with no clear push from buyers or sellers. Traders usually watch what happens in the next candles for direction.
This pattern is very rare, especially on higher timeframes. It most often appears in periods of minimal trading activity, like pre-market, after-hours, or in illiquid securities. Its occurrence is considered a statistical outlier compared to other candlestick patterns.
A four price doji can form on any timeframe, but it is seen much more often on short timeframes such as 1-minute charts or in low-volume assets. On daily or weekly charts, its appearance is very uncommon.
On its own, the four price doji is not widely used for trading signals due to its reflection of low activity and indecision. However, in multi-candle patterns or at key market levels, it may sometimes provide insight when combined with other technical signals or larger trends.