The markets love drama, and one of the signals that represent it clearly, is the High Wave candlestick Pattern. It is a candle that pops up when the buyers and the sellers go head-to-head, leaving behind a tiny body with long wicks on both sides.
It basically screams confusion on the charts, and that is exactly why traders pay attention to it. The High Wave Candlestick Pattern might show up before the trend pauses, flips, or starts to lose its strength. When the traders understand what this pattern is hinting at, they are able to identify uncertainty early and make cleaner, confident trading calls during volatile market phases.
Read this blog to have a complete understanding of the High Wave Candlestick Pattern, how it forms, how it can be identified, and much more.
What is a High Wave Candlestick Pattern?
A High Wave candlestick pattern is a single-candle formation with a small real-body and long upper and lower shadows, which indicates market uncertainty and high volatility.
These candlestick patterns signify that while the prices have fluctuated significantly, neither the buyers nor the sellers have gained control, which leads to a close near the opening price.
This pattern can suggest a probable trend reversal or a consolidation phase, and its significance is increased when it forms at the support or resistance levels.
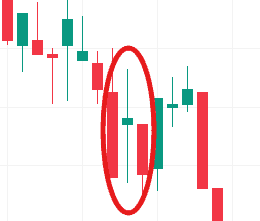
Here’s an example of a high wave candlestick pattern appearing in the charts.
Formation of High Wave Candlestick Pattern
The High Wave candlestick forms during the periods of extreme market indecision and high volatility, where both the buyers and the sellers aggressively push the prices in both directions, but neither of them gains control, which results in the price closing near its open.
- Initial Movement: In the early session, one of the sides, let’s say the buyers in an uptrend, attempts to drive the price in their direction.
- Opposition: The opposing side, the sellers, then steps in with equal force, pushing the price back below the opening price.
- Equilibrium at Close: The price might wildly fluctuate. However, it ultimately settles near the opening price by the end of the period
Characteristics of a High Wave Candle
- Small Body: The most prominent feature is a small real-body, indicating a very minor difference between the open and close prices. And, the color of the body, whether red or green, is less of a concern than the overall structure.
- Long Shadows (Wicks): The long upper wick shows that buyers attempted to push the price higher but were met with strong selling pressure that reversed the upward movement represented by the long lower wick, and vice versa.
- Disproportionate Shadows to Body: The upper and lower shadows are significantly long, and at least twice the length of the small body, which highlights the wide price fluctuations within the period. A greater level of market indecision is indicated with longer shadows.
- Appearance: It visually resembles a spinning top candlestick pattern, but with much more extended wicks.
Psychology Behind High Wave Candlestick Pattern
The market indecision suggests that neither the bulls nor the bears are in control, which leads to high volatility and trend exhaustion or reversal.
- Balanced Pressure: The high wave candle represents strong price swings in both directions, with the buyers and sellers rejecting each other’s moves. It closes near the open, which signals a balanced pressure and a clear no-win situation.
- High Volatility and Uncertainty: The long shadows reflect a period of significant price fluctuations and market volatility, which is driven by the uncertainty about the future direction.
- Trend Exhaustion: When a high wave pattern appears after a prolonged upward or downward trend, it signals that the current trend is its losing momentum, and the dominant party is facing strong opposition and may be exhausted.
- A Pause for Thought: The pattern acts as a signal for the traders to pause and wait for more information. It suggests the market is taking a breather before deciding on its next move, which could be either a reversal or a continuation after consolidation.
How to Trade Using High Wave Candlestick Pattern
- Interpreting High Wave Candlestick Pattern: If the candle appears after an uptrend, near the resistance level, it might signal a bearish reversal. And, if it appears after a downtrend, near the support level, it might signal a bullish reversal. During a sideways market, its appearance usually confirms an ongoing consolidation.
- Patience: The most important rule is to wait for the next candle or a confirmation candle before entering a trade, and not to trade based on the high wave candle itself, as false signals might occur due to high volatility.
Breakout Trading Strategy with High Wave Candle
The breakout trading strategy is focused on entering a position once the price moves decisively in a direction.
- Identify & Confirm the Pattern: The traders, once they identify the High Wave candle, will wait for another candle to close clearly above the high of the High Wave candle for a bullish breakout, or below the low for a bearish breakout. This is an entry trigger.
- Entry Point: The traders might wait for a bullish confirmation candle to close, and then place a buy order just above the High Wave’s high, for a long position, and wait for a bearish confirmation candle to close, then position a sell order just below the High Wave’s low, for a short position.
- Stop-Loss Placement: The traders might set their stop-loss beyond the opposite end of the High Wave pattern. And, in a long setup, they might place it below the pattern’s low, and in a short setup, they position it above the pattern’s high.
- Take-Profit Target: The traders might set a profit target based on their risk-to-reward ratio or the next support and resistance level.
Confirmation Techniques for High Wave Pattern
- Volume Analysis: An increase in the trading volume on the confirmation candle adds credibility to the breakout or reversal. The high volume indicates a strong market participation in the new direction.
- Support and Resistance Levels: The pattern is most significant when it forms near the support or resistance levels, as these are decision points in the market.
- Technical Indicators: the traders can use indicators Relative Strength Index (RSI) for overbought or oversold reversals, moving averages for trend alignment, and Bollinger Bands to spot consolidation that may lead to a breakout
High Wave vs Doji vs Spinning Top
Let’s see how the High Wave candlestick pattern distinguishes itself from Doji and Spinning Top.
| Feature | High Wave | Doji | Spinning Top |
| Body | It has a smaller real body, compared to the spinning top candle | It has extremely small or non-existent real body | It has a short but a bigger real body compared to high wave, |
| Shadows | The upper and lower wicks or shadow are more than twice its body | It has moderate-to-long upper and lower shadows | It has long shadows on both sides |
| Indications | It indicates volatility, and price fluctuations before closing near the open. | It indicates a perfect or near-perfect stalemate between buyers and sellers. | It indicates indecision with a clear price range covered during the session, a tug-of-war. |
High Wave Candlestick Examples with Charts
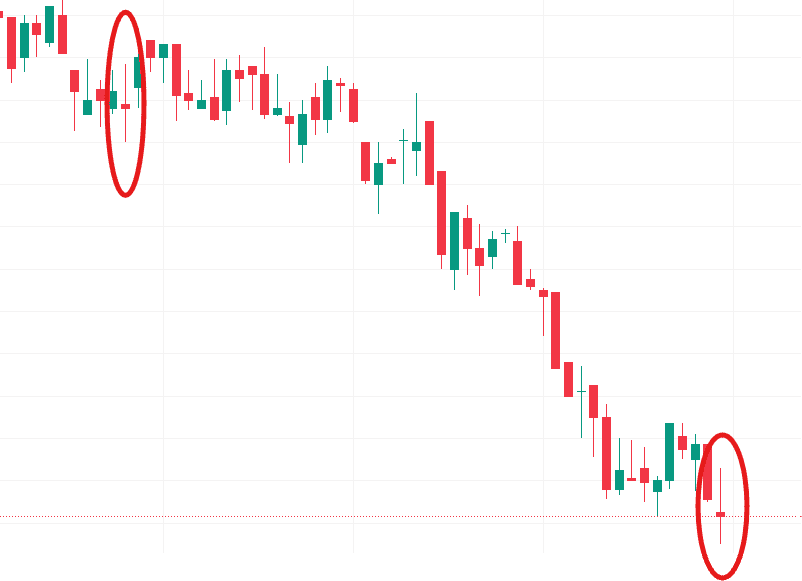
In this 1-minute chart of Tata Consultancy Services Limited, as on 18 November 2025, a few High Wave candles are visible.
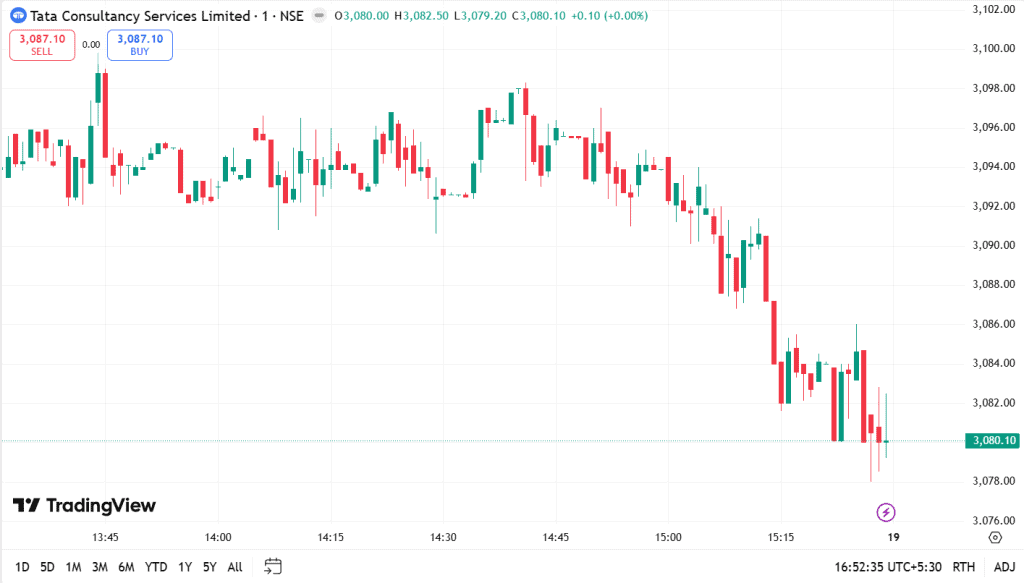
On this chart, a couple of High Wave–style candles form during the sideways movement before the drop. These candles show up when the price keeps getting pulled both ways, especially around 02:55 PM – 03:05 PM, where the wicks stretch out while the bodies stay tight. Each time one appears, the price briefly falls, then loses strength, leading into the clean breakdown that follows. The cluster of these candles right before the downmove highlights the fading momentum and the pressure building toward the eventual slide.
Common Mistakes When Trading High Wave Candle
- Over-reliance on a single pattern: The High Wave candle indicates market indecision, but not a guaranteed reversal or continuation. Therefore, trading only based on its appearance might lead to misleading signals and poor decision-making.
- Ignoring the bigger market context: The significance of a High Wave candle depends heavily on where it appears in the market, let’s say at the end of a strong trend or during a consolidation phase. So, ignoring the overall trend and market sentiment might lead to misinterpretations of its true implications.
- Failing to wait for confirmation: If a trader takes any impulsive actions by entering a trade immediately after identifying a High Wave candle could be a major pitfall. The pattern indicates uncertainty, so it is important to wait for the next one or two candles to confirm the direction of the market’s future move.
Best Timeframes to Use High Wave Pattern
A trader’s choice of timeframe for utilising the high wave pattern usually aligns with their trading style and objectives. However, here are some examples of how the traders might consider using the following timeframes:
- Traders might use 5-minute, 15-minute, or 1-hour charts, in case of scalping or intraday trading, for making quick decisions and capturing short-term volatility.
- Swing traders might use 4-hour or daily charts to balance signal clarity with trade frequency, which is suitable as they hold positions over several days.
- Position traders might use daily, weekly, or monthly charts, which offer the most reliable patterns for long-term trend analysis, and require patience for setups..
Summary and Key Takeaways of High Wave Pattern
The High Wave candlestick pattern captures the pure market hesitation, which is marked by a small real body and long shadow that signals a temporary balance between the buyers and the sellers.
It is more useful when it is combined with trend context, support-resistance levels, and confirmation candles. The traders might use it to identify pauses or reversals, avoid forced entries, and read the momentum shifts. Therefore, with a proper confirmation, it becomes a reliable tool for timing better trades.
FAQ‘s
A High Wave candlestick pattern is a single-candle formation with a small body and long upper and lower shadows or wicks, which indicates market indecision and high volatility.
The traders wait for a confirmation candle to break above the pattern’s high or below its low, then place a buy or sell stop order above or below the pattern’s high or low, respectively, and set a stop-loss just beyond the opposite side of the pattern to manage risk, and use other technical indicators, and consider the bigger market context.
A Doji has the same open and close prices, indicating indecision, while a High Wave candlestick also has a small body, but features very long upper and lower shadows, showing greater market volatility and uncertainty.
The High Wave candlestick pattern is neutral to slightly bullish or bearish, indicating indecision in the market rather than a strong directional bias. It suggests a period of transition or consolidation.
The High Wave candlestick pattern has low to moderate reliability on its own because it primarily signals market indecision and high volatility, and not a trend direction. Its effectiveness is significantly enhanced only when it is used with other technical indicators, volume analysis, and confirmation candles.
The High Wave pattern can be observed across all timeframes, but its signals are considered more reliable on longer intervals such as hourly, daily, or weekly charts, due to reduced market noise. The shorter timeframes produce more frequent but less dependable signals.
The traders might look for increased volume on the candle itself or use indicators like the Relative Strength Index (RSI) for overbought/oversold conditions, to confirm a High Wave signal.