Options trading can be exciting, but it’s not something you dive into blindly. With so many moving parts, price, volatility, and time decay, it helps to have a clear set of tools that guide your decisions. That’s where top indicators for options trading come in. Whether you are new to options or even if you are just trying to hone your strategy on how to play the options, the right indicators can be everything. We are going to discuss the best ones in this blog that veteran traders depend on, and how you can as well.
What is Options Trading?
Options trading entails the buying and selling of contracts, which help you to gain the right, but not the obligation, to either buy or sell an underlying asset at a certain price prior to a deadline. It can be of two principal types: calls (providing a right to buy) and puts (providing a right to sell). Options are used by traders as a hedge against positions already held, to earn income, or make speculations on the future price movement. Timing and direction hold the key to success, and that is how top indicators for options trading hold an important position.
What Are the Top Indicators For Options Trading?
One of the most important metrics that can provide insight regarding the expectations that the market has on the volatility of a stock is the implied volatility. High IV and low IV have higher and lower option premiums, respectively. IV signals traders’ expected movement, not direction. The traders tend to refer to IV in determining whether to purchase or sell an option.
This indicates the overall amount of open contracts (Calls or Puts) that are yet to be settled. It also provides a market activity/ liquidity insight. During expiry weeks, high OI around a strike may be a magnet for price action. The OI rising in conjunction with rising prices can be a sign of strength in the trend, as OI declining in a move can be a sign of fading momentum or offloading built-up positions.
- Option Greeks (Delta, Theta, Vega, Gamma)
Greeks help measure option risks:
- Delta is an indication of the extent a change in price of an option fluctuates with the underlying stock.
- Theta refers to time decay, the percentage amount of value the option loses with expiry.
- Vega calculates the option price change from an IV change.
- Gamma is the measurement of change in Delta.
Traders will do this to tighten up or loosen their position based on their perspective of the market.
Volume contributes towards a display of the traded contracts per day. A greater volume usually translates to an increased interest and liquidity. When trading volume jumps at certain strike prices, it may signal interest from big institutions or traders taking the opposite view. It may provide better understanding to compare the volume with open interest: low OI and high volume possibly indicates the opening of new positions.
- Relative Strength Index (RSI)
RSI is a momentum indicator between the range of 0-100. Any reading of above 70 is typically considered to be an overbought state, whereas below 30 is considered to be an oversold state. RSI is used by options traders to detect the potential areas of reversals.
- Moving Averages (MA, EMA)
Moving Averages reduce price and reveal trends. The Simple Moving Average (SMA) is the average price over a given period, while the Exponential Moving Average (EMA) gives more weight to recent prices. Crossovers (like 9 EMA crossing above the 21 EMA) can serve as entry or exit signals.
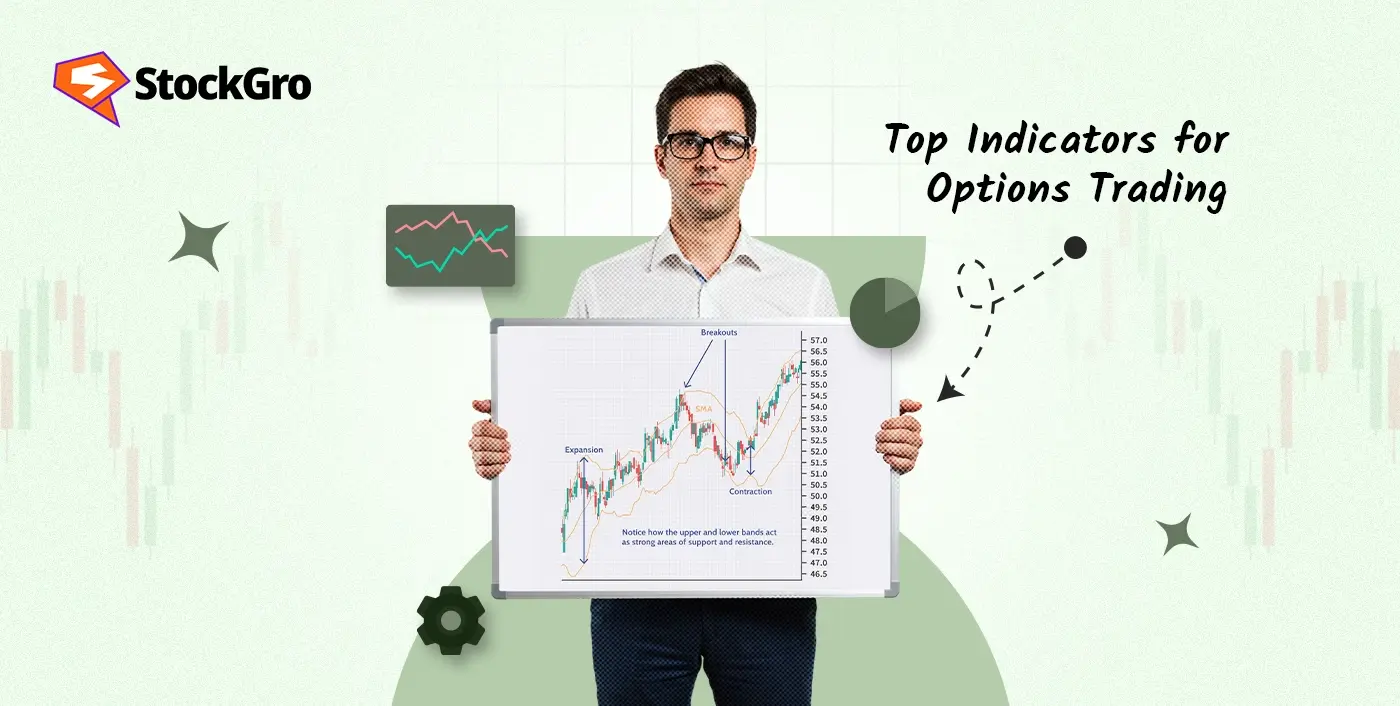
- Bollinger Bands
Bollinger bands are moving averages with two bands two standard deviations below and above. They gauge volatility and extremes in the price. Once the price reaches the upper and lower band, it can be overbought and oversold, respectively. It is utilised in mean reversion strategies by options traders, who may sell options at the band edge when the price is reverting towards the middle.
- Put Call Ratio (PCR)
The formula to determine PCR is put options and call options divided by volume. The value of the PCR above 1 indicates the possibility of a bearish mood, and a PCR below 1 may indicate bullishness. Oddball readings may be contrarian opportunities. As an example, a PCR that is extremely high may indicate a market that is too gloomy, and this may provide an opportunity to bounce back.
Why Use Top Indicators for Options Trading?
Options trading is a highly variable concept that goes by the price movement and volatility, and time decay, among others. Signals provide a way to filter out all that noise and give you good, orderly indicators. They will help in the timing of your entry and exit, determining the risks involved, formulating market sentiment and validating the prevailing trends.
How to Combine Indicators for Better Option Trades
There is no single indicator that is ideal. Two, or more, give a better signal. For example:
- Use Volume after RSI confirms overbought/oversold zones.
- Pair IV with Bollinger Bands to find entry points that are high volatility.
- A sentiment and positioning with clarity are Open Interest with PCR.
- Making the trade widely is the key, when several pointers are pointing in the same direction, your trade becomes more tried and tested.
Tips for Using Indicators in Options Trading
- Don’t overcomplicate
Use only two or three top indicators for options trading at a time, per trade. An abundance of them can produce mixed messages, which bring about confusion and the indecisiveness of acting at the moment that it is required.
- Understand the logic
Before basing on any indicator, you should take time to learn what the indicator measures and how it behaves under various market conditions. Being triggered by signals without the context may result in wrong choices.
- Keep backtesting
Stress test your strategies with past data to determine how they would have performed in prior years. This instils confidence and serves to hone your strategy prior to betting with legitimate money.
- Set alerts
All trading platforms on the market allow you to set alerts to go up or down, based on price. This helps you avoid sitting by the screen all the time and also keeps you off important opportunities.
- Pair with price action
Indicators are tools, not the final word. Use them in concurrence with what the price is already indicating; trends, lines, support/resistance being broken, and creating patterns.
Common Mistakes to Avoid
- Relying on one indicator
A reliance on a single signal to gain entry or exit may result in false alarms and loss of context. At least one tool or rather the price action should be verified to increase precision.
- Ignoring market conditions
Top indicators for options trading do not track each market in the same manner. What may work in a moving market may send entirely wrong signals in a range bound or side market.
- Blindly following PCR or OI
Put-Call Ratio (PCR) or Open Interest (OI) on its own can be very strong only when read at the right context. These measures can deliver erroneous impressions of market power without considering the direction of price or volume changes.
- Overtrading
There is no need to do everything because several warning signs are in motion. An excessive number of trades may result in the inability to manage risks and burn out.
- Forgetting time decay
In options trading, Theta, or time decay, eats into your premium value as expiry nears. Ignoring this can turn a technically correct trade into a losing one if your timing is off.
Related Tools for Options Traders
- Options Chain Analysis Tools: NSE/BSE or brokerage platforms offer detailed option chains.
- IV Rank/Percentile Trackers: These help you understand how current IV compares to historical IV.
- Greeks Calculators: Useful for estimating Delta, Theta, Vega, and Gamma quickly.
- Heatmaps & Flow Trackers: These track unusual activity and volume spikes.
Conclusion
Mastering options trading is not about luck, it’s about preparation. Indicators act like guiding lights, helping you time your trades better, manage risks, and improve accuracy. From Implied Volatility to RSI, Open Interest to Bollinger Bands, each indicator serves a purpose. The more you understand and combine them wisely, the stronger your trading decisions become. Don’t rush, observe, interpret, and act with clarity.
FAQs
The Relative Strength Index (RSI), Moving Averages (MA), Bollinger Bands and Implied Volatility (IV) are considered the top indicators of option trading. These are useful in determining momentum, trends, volatility of prices and reversals. Open Interest and Put-Call Ratio can also be utilised in volume-based insights. Not every single indicator suits all trades: it is about picking a few, which suit the strategy and current conditions in the market.
No, indicators cannot assure profit in options markets. They are like maps of decision-making and not crystal balls. Markets are sensitive to a number of random events such as news, sentiment, and global events. Indicators are used to increase the timing and decrease emotional trading but with limitations. Indicators enable smart traders to manage risk and increase their chances of making money, rather than predicting it.
Greeks estimate the sensitivity of the price of an option with regard to various variables. Delta indicates the amount the price of option changes when there is a change in the underlying asset. Theta monitors time decay that is significant when it comes to short-term trades. Vega is sensitive to changes in volatility, and Gamma monitors the Delta changes. Rho gauges the effect of an interest rate.
Get top indicators for options trading that are suited to specific uses, such as a trend direction indicator (e.g. a Moving Average), a momentum indicator (e.g. RSI or MACD) and a volatility indicator (e.g. Bollinger Bands or IV). It is not wise to have several indicators which provide the same kind of signal. Never take signals at face value without considering the price action and market structure.
RSI, VWAP (Volume Weighted Average Price), Moving Averages (such as 9 or 21 EMA) are best to use in intraday options trading. RSI is also used to determine whether the price is overbought or oversold. VWAP gives an average price in real-time and serves to estimate institutional trading. Short term movement of trends is followed by fast EMAs. The combination of these tools assists in accurate buying and selling at fast-paced markets.