It’s easy to start trading just because the market is open, even when there’s no clear setup. But that habit often leads to rushed entries and scattered decisions. The inside bar candle pattern helps you slow down and wait. It shows up when the price stays quiet for a bit, moving within a small range. This pause can help traders step back and wait for a cleaner setup. In this blog, we’ll look at what the inside bar pattern is and how it’s used to avoid random trades and stay more focused.
What is an Inside Bar Candle?

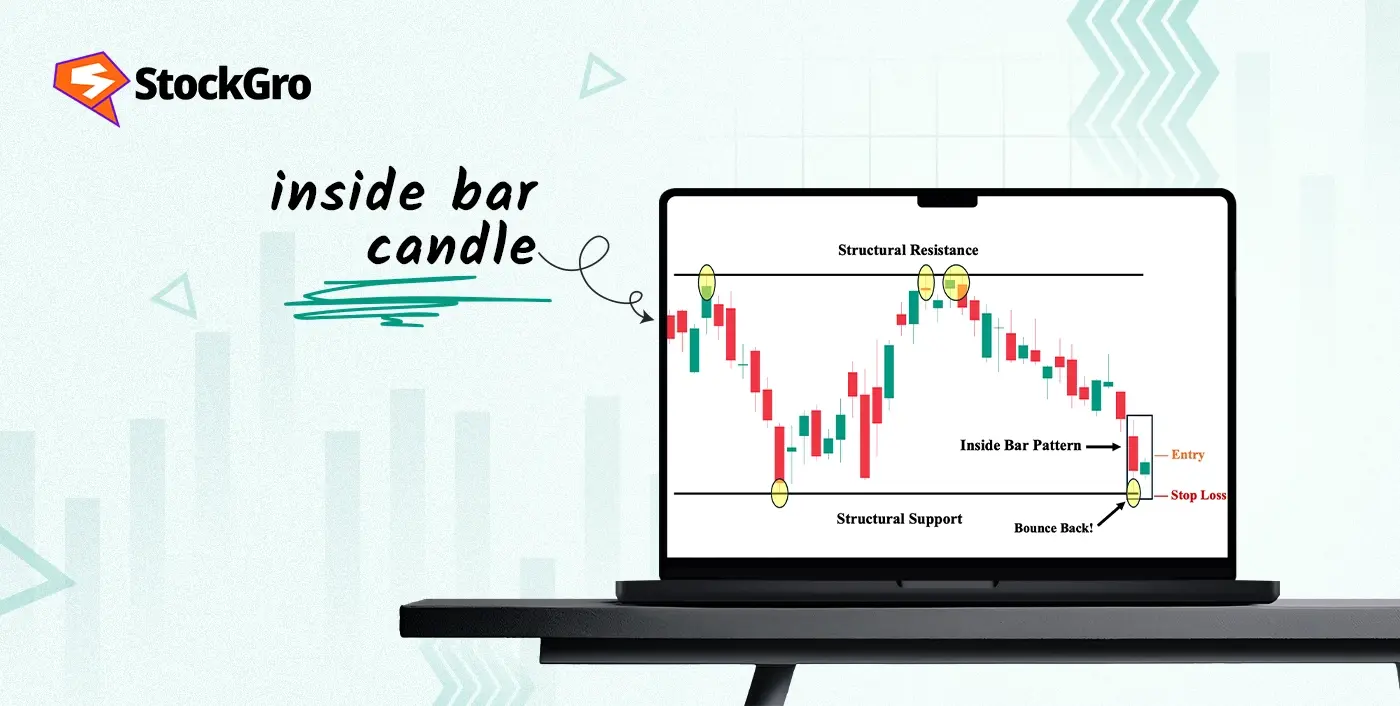
Inside bar candle pattern is a two bar price action strategy where the second candle is smaller within the first candle which shows market consolidation. The first candle is the “Mother Bar,” which completely contains the high and low of the next one, called the “Inside Bar.” This formation is generally used as a technical indicator which marks a pause in price action and is watched for breakout moves. It can appear across timeframes but is generally more dependable on longer ones like the daily chart.
How Does an Inside Bar Candle Form?
It has two candles which form when a smaller candle gets fully covered by the range of the previous larger candle. It consists of two types. Here’s how these types form:
- Bullish inside candle: Forms during a rising market. The first candle (mother bear) is large and bearish, followed by a smaller bullish candle that stays within its range. A price break above the smaller candle’s high signal strength.
- Bearish inside candle: Appears after falling prices. The mother bear m is large and bullish, followed by a smaller bearish Inside Bar. A breakout below the inside bar suggests continued downward price activity.
What Does the Inside Bar Indicate?
An inside bar candle shows that price has temporarily contracted into a tighter range than the previous session. This often happens when traders are waiting for new information or price levels to be tested. The pattern may mark the start of a continuation or a change in direction, depending on where it appears. When followed by a breakout, it can attract attention from traders who focus on price setups. Many traders view it as a signal that attention should be paid to what happens next.
How to Trade the Inside Bar Candle
Inside bars are used to plan entries when price contracts before making a move. Below are the steps usually followed when trading this pattern:
- Analyse previous price movement: Look at the candles before the Inside Bar, if they mostly rise, the setup may point upward; if they mostly fall, it may point downward.
- Wait for a breakout: Watch for price to cross above the high or below the low of the Inside Bar pattern.
- Plan the entry: Set a buy order just above the high or a sell order just below the low of the Inside Bar.
- Crosscheck to confirm: Some traders combine this with volume spikes, moving averages, or breakouts from key chart levels.
- Manage risk: Adjust stop-loss levels once the trade starts to reduce exposure or lock in gains.
- Set an exit: Choose between fixed targets, trailing stops, or closing at major support or resistance.
Inside Bar Trading Strategies
Inside bars can be used in multiple ways for technical analysis depending on where they appear on the chart. The main strategies are as follows:
- Trade breakouts in the same direction as the larger price movement by placing a buy stop above or a sell stop below the mother bar’s range, with a stop-loss at the opposite end or mid-point.
- Use inside bards at major support or resistance levels to attempt reversal trades, entering on a breakout against the prior price movement.
- When two or more inside bars form within the same mother bar, treat it as a coiling setup and prepare for a stronger breakout.
- Focus on the daily chart to reduce false breakouts and improve clarity when trading the pattern.
- Align inside bar entries with the larger price direction to keep the strategy simple, especially if you’re new to reading chart patterns.
- Practice classic entry methods by setting stop orders just outside the mother bar’s high or low to catch breakout moves cleanly.
Best Timeframe to Trade the Inside Bar
Inside bar candle can appear on any timeframe, but the daily chart often provides clearer and more reliable setups. On lower timeframes, there are usually too many patterns, which may lead to noise or quick reversals. Traders looking for faster moves may use the pattern on 15-minute charts or lower, but this needs more caution. After identifying an inside bar, it’s important to wait for it to fully complete. Some traders also refer to nearby support and resistance or use technical tools before acting. On higher timeframes like daily or weekly, Inside Bars are easier to interpret and manage for entry and exit.
Advantages of Using the Inside Bar Pattern
The main advantages of using the inside bar candle pattern include:
- The pattern is simple to spot on any chart once you know what to look for.
- Can be applied to both rising and falling price situations.
- Offers multiple opportunities for trade setups, especially within active sessions.
- The narrow range often allows for tighter stop-loss placement.
- It supports clean entries when used with core price levels.
- Works well with various approaches, including breakouts and reversals.
- The pattern suits both new and experienced traders due to its clear rules.
- Helps maintain discipline by encouraging entries only when a structure is visible.
Limitations of the Inside Bar Pattern
The common limitations of this candlestick pattern are as follows:
- In sideways markets, inside bars generally trigger false breakouts.
- Waiting for confirmation can delay entry and tie up trading capital.
- Some setups provide small profits due to the narrow price range.
- The pattern may occur too frequently, causing confusion without filters.
- Difficult to trade in markets with rapid, unpredictable price movements.
- Reversal inside bars are harder to execute without added skill or tools.
- The setup is less reliable when it appears randomly on lower timeframes.
- It requires confirmation from other signals to improve accuracy.
- Entry and exit planning can be unclear for beginners.
- Overuse of the pattern may lead to poor trade selection and overtrading.
Inside Bar vs Outside Bar: Key Differences
While the inside bar forms completely within the range of the previous candle, the outside bar does the opposite. It has a higher high and a lower low than the candle before it, showing a wider price movement. Here’s how they differ:
| Feature | Inside bar | Outside bar |
| Candle range | Fully within the previous bar | Exceeds previous bar high and low |
| Volatility | Shows contraction | Shows expansion |
| Common use | Signals breakouts from compression | Indicates aggressive price reaction |
| Setup type | Often used in breakout setups | Can be used in reversal or strong moves |
Inside Bar Candle Examples on Chart
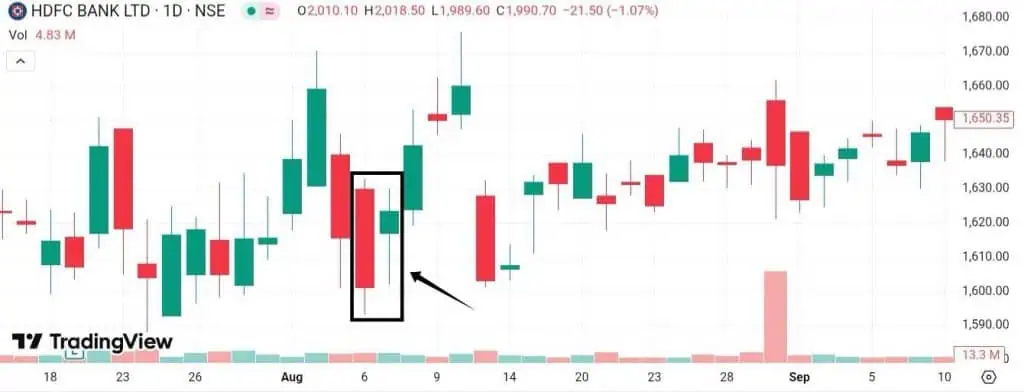
To take an example, this is the daily chart of HDFC Bank Ltd. The first image shows a bullish inside bar pattern formed on August 6, 2025.
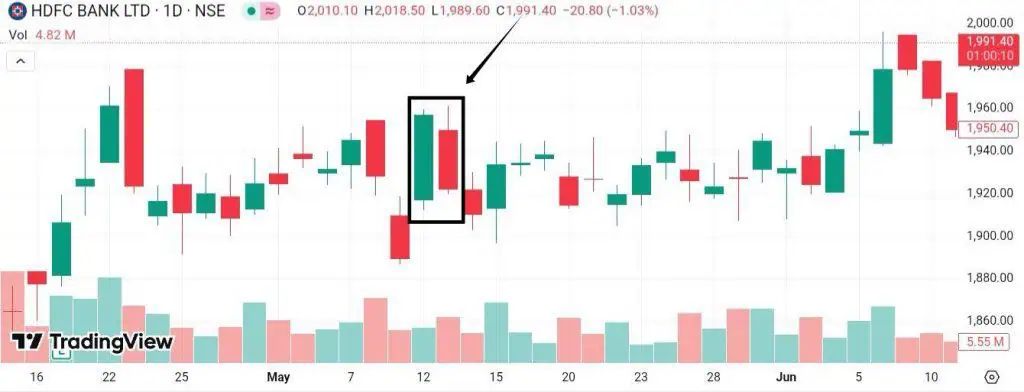
While the second shows a bearish inside bar on May 13, 2025. Both candles stayed within the range of their previous day’s candle, reflecting short pauses before price moved again.
Related Candlestick Patterns to Know
The patterns below share structure or often appear along with inside bar candle:
- Harami: This pattern consists of a small candle completely within the range of the previous larger candle, much like an Inside Bar. It usually suggests a pause in price action and can appear in both rising and falling markets.
- Fakey pattern: A variation of the inside bar where price breaks out from the setup but quickly reverses direction, often forming a trap for early breakout traders. It signals failed breakouts and appears after consolidation.
- Inside day: A daily version of the Inside Bar pattern, where the entire range of one day’s price movement fits within the previous day’s high and low.
- Coiling inside bars: When multiple Inside Bars form within the same mother bar, each smaller than the last, this extended consolidation can lead to stronger breakouts. These are often seen before sharp directional price moves.
Conclusion
Sometimes, the smartest move is waiting. The inside bar candle shows when the market is catching its breath, giving you space to plan rather than chase. It’s a simple formation but offers valuable insight, especially when paired with other technical indicators. When price goes quiet, the inside bar helps you listen more closely to what might come next.
FAQs
Beginners can use the inside bar because it is easy to spot on charts. It helps show when the market is pausing before making the next move. Using it together with other signals may help reduce mistakes.
An inside bar can be bullish or bearish, depending on where it appears. In rising markets, it might point to more gains, while in falling markets, it can hint at more declines. Sometimes it just shows a pause before a new direction starts.
The inside bar pattern is quite reliable when prices are trending clearly either up or down. It works less well in quiet or sideways markets. Many traders use other signals, like volume or breakout confirmation, to increase confidence in the setup.
Beginners can use the inside bar easily since it’s a simple two-candle pattern to spot. It tells traders when the market is taking a break, and with practice, beginners can combine it with other indicators to improve their trading decisions safely.
The inside bar candle does appear on intraday charts like 5 minute or 15 minute timeframes but such setups often come with more noise and false signals. While some intraday traders use it, the pattern works better on higher timeframes like 1 hour or daily charts where price action is more.
An inside bar top candlestick refers to an inside bar pattern that appears near the top of an uptrend. It occurs when the current candle’s high and low are completely within the range of the previous candle. At the top of a rally, it can signal consolidation or a potential reversal, especially if followed by a bearish breakout.
A bearish inside bar forms when an inside bar appears after an uptrend and price breaks below the low of the mother candle (the previous larger candle). This breakdown can signal increasing selling pressure and a potential downward move.
An inside bar indicates consolidation and reduced volatility. It shows that the market is pausing before making its next move. Traders often wait for a breakout above or below the mother candle’s range to confirm direction.
An inside bar itself is neutral. It becomes bullish only if price breaks above the high of the mother candle, especially when it forms during an uptrend or near a support level.