
Charts sometimes throw confusing signs: a stock gaps up, drifts sideways, and then gaps the other way, leaving traders wondering if it’s a trend continuation or a reversal. When this happens, the island reversal pattern can be a cautionary signal that the market’s mood is shifting dramatically. If you want to learn how to spot this rare but reliable pattern and trade it wisely, read this full guide.
What is the Island Reversal Pattern?
The island reversal pattern is a technical analysis formation commonly discussed along with other major candlestick patterns that signal likely turning points in price movement. It is defined by a compact trading range separated from the broader price action by two distinct gaps, an exhaustion gap leading into the pattern and a breakaway gap leading out of it. Because it sits apart from other price action, the candle group appears as an “island,” reflecting a rapid swing in sentiment in either direction.
Formation of the Island Reversal Pattern
The formation of this pattern involves four distinct phases that develop sequentially, as follows:
- Preceding trend: A clearly defined uptrend or downtrend must be in place before the pattern begins, establishing the market momentum that is about to reverse.
- Initial gap (exhaustion gap): The pattern begins with a sharp gap, called the exhaustion gap, pushing further in line with the existing market direction. For an uptrend, this is a gap up; for a downtrend, it is a gap down. This often represents the final surge of buying or selling pressure.
- Consolidation phase (the island): Following the initial gap, prices trade within a relatively tight range for a period ranging from a single day to several weeks. This consolidation forms the isolated “island” where momentum begins to stall.
- Reversal gap: The pattern completes itself with a gap opening that goes against the earlier move, marking the turning point. This gap leaves the consolidation phase isolated, confirming the reversal and establishing the visual island structure on the chart.
Key Rules & Visual Structure of Island Reversal
Identifying a valid island reversal pattern requires strict adherence to visual and volume-based criteria. These rules ensure the pattern represents a genuine shift in supply and demand rather than random market noise. To identify a valid structure, traders look for specific characteristics, which include:
- Gap alignment: The two gaps framing the island (the initial exhaustion gap and the subsequent breakaway gap) should occur at approximately the same price level. This results in a noticeable gap isolating the island from the candles before and after it.
- Volume profile: Volume behavior is a critical confirmation tool. Typically, volume is high during the first gap, decreases or flattens during the consolidation (island) phase, and spikes significantly on the second gap to confirm the reversal.
- Isolation: The candlesticks within the island must not overlap with the price range of the preceding trend or the subsequent reversal move. The visual separation is distinct.
- Duration: While the pattern can form over various timeframes, the “island” portion typically lasts anywhere from a few days to a few weeks. Very short durations might be less reliable than those with a defined consolidation period.
Types of Island Reversal – Bullish & Bearish
The island reversal pattern can signal the end of either a rising or falling market. While the structural mechanics are similar, the implications and directional cues differ. The two primary variations of this pattern are classified as follows:
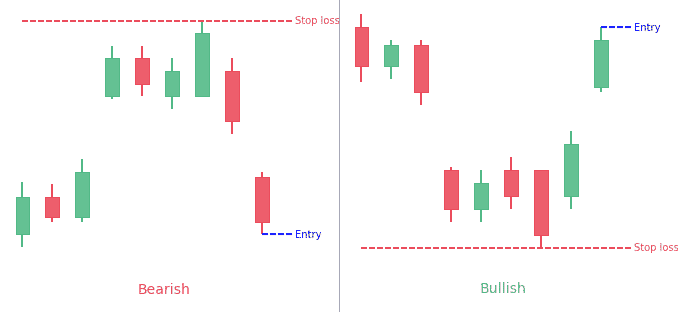
- Bullish island reversal (Island Bottom)
This formation emerges once the market has been falling and reaches its lower stage. It opens with an exhaustion gap downward, then enters a flat, range-bound movement. The reversal is confirmed when the price gaps up (breakaway gap) to leave the lower consolidation isolated. This pattern points to the end of heavy selling, creating conditions for a potential upward move.
- Bearish island reversal (Island Top)
This pattern is usually observed once an uptrend has stretched to its top levels. It begins with an upward gap, then moves into a stretch of price stabilisation near the top. The pattern completes when the price gaps down, isolating the upper trading range. This structure indicates that buying momentum has depleted and a potential downtrend is beginning.
How to Trade the Island Reversal Pattern
Trading this pattern comprises a strategic approach to entry, risk management, and target setting based on the structure of the gaps. The strategy relies on the confirmed isolation of the price action to signal a new directional bias.
- Entry, Stop-Loss & Target for Island Reversal
The standard approach involves defining precise levels for executing the trade mechanics such as:
- Entry point: A trade is typically entered only after the second gap (the breakaway gap) has formed and the price moves away from the island. Some strategies advise waiting for the candle following the gap to close to prevent a “fakeout.”
- Stop-loss placement: To limit possible losses, the stop-loss is usually placed at the extreme tip of the island. For a bearish pattern, this is the highest high of the island; for a bullish pattern, it is the lowest low.
- Profit target: The minimum target is often calculated by measuring the height of the island (the distance from the gap to the extreme tip) and projecting that distance from the entry point. Previous support and resistance levels are also used as secondary targets.
- Confirmation & Risk Management for Island Reversal
Ensuring the validity of the pattern is essential to reduce the risk of false signals. The main factors to verify before committing to a position include:
- Volume analysis: Heavy volume activity accompanying the second gap reinforces the shift, confirming that the reversal is supported.
- Gap integrity: The gaps should remain unfilled in the short term. If the price immediately moves back to close the gap, the pattern is considered invalidated.
- Trend context: Traders verify that the pattern is forming at a logical point of support or resistance within the broader market trend.
- Risk-reward ratio: The potential profit target should offer a favorable return compared to the risk defined by the stop-loss distance.
Island Reversal vs Other Gap Patterns
The island reversal pattern shares similarities with other patterns that are associated with price gaps. While other gaps might signal the start or continuation of a trend, the island reversal specifically signals a U-turn in price action. Distinguishing between these helps in avoiding misinterpretation of market intent.
The differences between the island reversal and other common gap formations are summarised in the table, as follows:
| Feature | Island reversal | Breakaway gap | Exhaustion gap |
| Structure | Isolated cluster separated by two gaps. | A single gap at the start of a trend. | A gap at the end of a trend, often filled quickly. |
| Context | Reversal signal (Top or Bottom). | Continuation or start of a new trend. | Signal that a trend is ending. |
| Gaps | Requires two opposing gaps. | Requires one gap in trend direction. | Requires one gap in trend direction. |
| Fill behavior | Gaps remain open initially. | Gap typically remains open. | The gap is often filled shortly after forming. |
| Outcome | Trend direction changes completely. | Momentum increases in the same direction. | Trend pauses or reverses (often becomes an Island). |
Real-World Examples of Island Reversal (Including Indian Markets)
A clear example of an island reversal pattern in the Indian market is as follows:
The chart of Danlaw Technologies India Ltd below shows this formation clearly. During August 2024, the stock price dropped suddenly, leaving a specific gap between the previous prices and the new lower trading range. This group of candles at the bottom formed the “island,” where the price stayed flat for several weeks without moving much higher or lower.

The pattern was completed on September 6, 2024. On this date, the stock price jumped up sharply, creating a second gap. This jump separated the island from the new rising prices. This visual setup, a drop, a pause, and then a sharp rise, shows exactly how a Bullish Island Reversal looks. The gap on September 6 confirmed that the trend had changed from down to up.
Common Mistakes & Limitations of Island Reversal
Traders should be aware of potential pitfalls when trading this pattern, which are:
- Premature entry: A common error involves entering a trade before the second gap has fully formed or confirmed. Anticipating the gap can lead to losses if the consolidation continues or the trend resumes.
- Gap filing: If the second gap is filled quickly (the price retraces back into the island range), the reversal signal is typically considered failed. This is often referred to as a “false breakout.”
- Low volume breakouts: A reversal gap that occurs on low trading volume lacks conviction. Without institutional participation (indicated by high volume), the price is more likely to reverse back to the original trend.
- Confusion with common gaps: In illiquid stocks or sideways markets, random gaps can create formations that look like islands but lack predictive value. Ensuring a prior trend exists is crucial to avoid this mistake.
- Subjectivity: Identifying the pattern can sometimes be subjective, especially if the gaps are small or if the consolidation period is irregular.
- Liquidity issues: In stocks with low liquidity, gaps are common and may not carry the same significance as they do in highly liquid markets.
Conclusion
Identifying this pattern shows a clear separation where the market momentum has shifted. While the gaps make the structure easy to spot, they do not guarantee a specific outcome. Financial markets move based on many factors, and chart patterns only suggest a likely direction, not a certain one. An island reversal pattern helps in staying informed of the opportunities at hand, but it does not remove the risks naturally involved in trading.
FAQ‘s
An island reversal is a technical pattern featuring two opposite gaps isolating a cluster of candlesticks, forming a visual “island.” It signals a potential major trend reversal with the price moving sharply away from the isolated area after consolidation, indicating a shift in market sentiment.
Trade the island reversal by entering after the second gap confirms the breakout direction. Place a stop-loss at the pattern’s extreme (highest high for bearish, lowest low for bullish). Set profit targets by measuring the island height or referencing support/resistance levels.
A bullish island reversal occurs after a downtrend with a gap down, sideways trading, then a gap up signaling a possible uptrend start. A Bearish Island Reversal happens after an uptrend with a gap up, consolidation, then a gap down, indicating potential downward momentum.
The island reversal is considered fairly reliable, especially when confirmed by volume spikes on the second gap and formation at key support or resistance levels. However, false signals can occur if gaps fill quickly or volume is low during reversal.
Island reversals appear on multiple timeframes, but daily or weekly charts provide stronger, more reliable signals due to longer consolidation and clearer price isolation. Intraday or very short timeframes may produce false signals because of market noise.
Confirm the pattern by observing a high-volume breakout on the second gap, ensuring the gaps remain unfilled. Also, check that the pattern occurs at logical support or resistance levels and wait for a breakout candle close beyond the island to confirm momentum.
Common mistakes include entering trades before the second gap confirmation, ignoring gap fills which invalidate the pattern, trading low-volume breakouts lacking conviction, confusing island reversals with random gaps in illiquid markets, and failing to confirm prior trend presence and volume support.