Price action feels a lot cleaner when the noise is stripped away. A line chart in technical analysis does exactly that, connects the closing prices to reveal the underlying direction without the distraction of intraday spikes.
A line chart shows where the market actually settled, not where it wandered around, which helps the traders to focus on structure instead of noise, while improving their decision-making in both short-term and long-term setups. When the traders learn to pair line charts with moving averages and trendlines, reading market direction becomes sharper, steadier, and far more intuitive, especially in the fast-moving Indian markets.
Keep reading to dive into line charts in technical analysis, how to read it with confidence, and how it strengthens the overall technical analysis game.
What is a line chart in Technical Analysis?
A line chart in technical analysis is a chart that connects the closing prices of an asset over a period of time, making it simple and easy to visualize trends and patterns. It reduces noise from non-essential data, such as the open, high, and low prices, providing a clear view of market sentiment and allowing for easy comparison of multiple assets.
How to read a line chart step-by-step? (NIFTY example)
Here’s how to read it the right way, using the NIFTY 1-Day chart with a 1-minute interval:
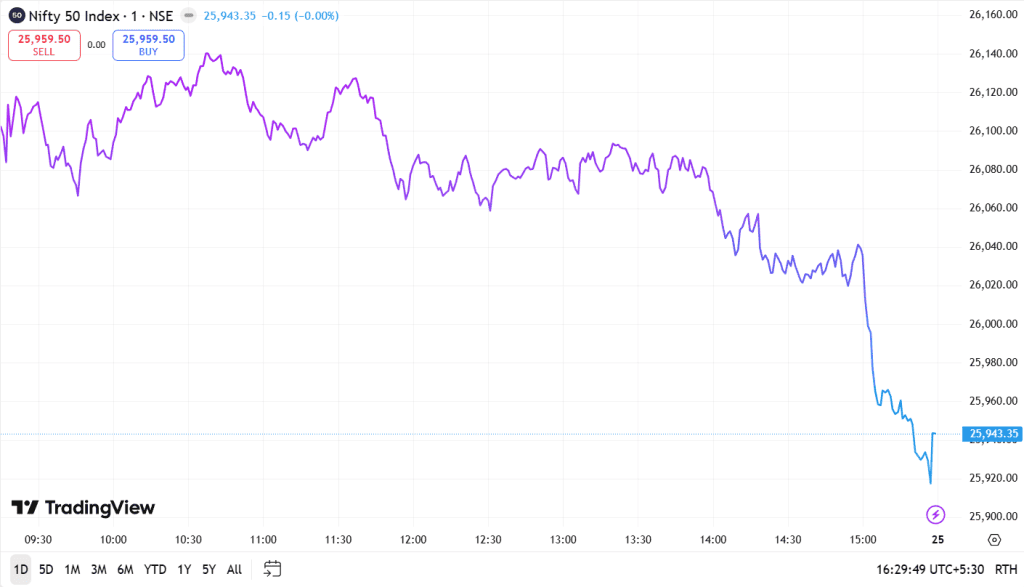
Step 1: Read the Axes and Understand the Structure
A line chart is a timeline of closing prices. The x-axis on the chart above tracks the session from morning to close, while the y-axis shows the price at each minute. When a trader identifies these two, the chart stops feeling abstract and starts behaving like a story, price rising, pausing, or sliding as time passes.
Step 2: Trace the Trend in the Closing Prices
In this NIFTY chart above, the line first lifts during the morning, then flattens, and eventually drifts lower.
The uptrend shows up as higher closes stacking over time, the downtrend forms when each cluster of closes drifts lower than the one before, the clear fall in the afternoon, and the sideways movement appears when the line wiggles within a narrow band.
Because the chart connects only closing prices, these shifts stand out without intraday noise.
Step 3: Add Context with Support, Resistance, and Indicators
The intraday peaks around mid-morning act as resistance, where the price repeatedly failed to continue higher. The afternoon dips marked support levels that held for a while before eventually breaking.

If a trader overlays moving averages, they will see whether NIFTY is trading above them, a bullish posture, or slipping below them, a bearish posture.
Additionally, other tools, such as RSI, MACD, or volume, can also reinforce whether a trend is strong or just wobbling.
In the above chart, the late-session breakdown was more convincing because the price closed below earlier support levels, signalling a real shift in pressure rather than a quick intraday spike.
Line chart vs Candlestick vs Bar — clear comparison
| Feature | Line Chart | Candlestick | Bar Chart |
| Data represented | Closing price | Open, High, Low, Close (OHLC) prices | Open, High, Low, Close (OHLC) prices |
| Visual display | It is a continuous line connecting closing prices | It is a rectangular body, that represents open to close range, with vertical shadows | It is a vertical line with horizontal ticks for open prices, on the left, and close prices, on the right |
| Market sentiment | It offers a simple, high-level view of the overall trend | It uses color-coding and body size to convey market sentiment | It provides detailed price action but less intuitive than candlesticks |
| Ease of use | It is very simple and easy to read, and ideal for beginners | It is highly visual and favoured by traders, and requires understanding of different patterns | It is less intuitive to interpret compared to the candlesticks |
| Use case | It is suitable in long-term trend analysis, identifying major support and resistance zones, and portfolio management | It is suitable for short-term trading, pattern recognition such as hammer, doji, etc., and real-time market sentiment analysis | It suitable for detailed price analysis, medium- to long-term trading, for traders preferring a simple view |
Advantages of line charts (Trend clarity & Noise reduction)
- Trend Clarity: The line charts work better at visualising trends over time, which makes it easy to see the direction and rate of change in data.
- Noise Reduction: The line chart connects data points with a single line and smooths out short-term fluctuations while highlighting the underlying patterns and reducing visual noise.
- Pattern Recognition: The continuous line in the chart helps the human eye to follow patterns, variations, and major turning points, which assist in forecasting future values and making decisions.
Limitations of line charts (No OHLC data)
- Only show one price point: The line charts only plot a single value for each time interval, the closing price, which means they completely avoid other important information like the opening price, the highest price, and the lowest price of that period.
- Hide price volatility and range: The line chart only connects the closing points, so it does not show how much the price moved up and down within each period, making it impossible to measure volatility or the full range of price movement.
- Incomplete picture for detailed analysis: For technical analysis, especially for short-term traders, using candlestick charts offers far more depth because they include open, high, and low prices. While, relying only on closing-price line charts becomes too simplified and hides the intraday price action that candlesticks reveal.
Using line charts for Support & Resistance
- Choosing the chart: The traders can start by selecting a line chart to focus on the closing price, which helps avoid minor price fluctuations.
- Identifying potential levels: The traders need to look for the areas on the chart where the price has repeatedly paused or reversed during a decline or a rise.
- Connecting the points: They can place a horizontal line on the chart to connect at least three of these price action zones. A support line reflects a level where price stopped dropping several times, while a resistance line captures the ceiling where price consistently failed to push through.
- Validating the line: The more times the price touches the line and bounces off it, the stronger the support or resistance level is considered.
- Incorporating trading: After identifying strong support and resistance lines, traders can use them to identify potential entry points, set targets, and spot breakouts.
Line charts + Moving Averages (best combo for trend)
The line charts are usually considered the best visualisation for displaying trends over time because they highlight continuous changes in data. When the traders overlay a moving average in the line charts, it creates a powerful combination for trend analysis.
The moving average smooths out short-term fluctuations and noise, revealing the underlying direction and momentum of the long-term trend that the raw data alone could not have. This visual synergy allows the analysts to identify the primary trend and potential shifts within it.
Line chart breakouts (trendline + closing price logic)
- Trendline Construction: The trendlines connect a series of closing price points, higher lows for uptrends, and lower highs for downtrends, which offer a simplified view of the trend while ignoring the intraday volatility.
- Breakout Confirmation: The breakout is confirmed only when a price’s closing point breaches the trendline. This avoids false signals from temporary intraday price fluctuations that may reverse later, while adding conviction to the potential trend change. The traders usually wait for a full day’s close for validation.
Intraday vs Swing trading — when to use line charts
| Aspects | Intraday | Swing Trading |
| Purpose | Line chart helps in identifying the short-term direction of an asset within a single trading day. | Here, the line chart helps in identifying and following mid-term price trends that last for a few days to weeks. |
| When to use | Day traders might use line charts to view the price action for the day | Swing traders might use line charts to see the wider market structure and larger swings. |
| What to look for | Day traders look for the trend and the overall momentum of the price movements throughout the day. | Swing traders look for larger swings or price movements that show the market shifting from bullish to bearish and vice versa. |
| Benefits | Line charts provide a clear overview of a day’s price movements without the noise of high and low prices. | Line charts also helps in focusing on the bigger picture trend and market structure, allowing the traders to hold trades longer as they mature. |
Common mistakes to avoid (chart misinterpretation)
- Missing Axis Labels: If the traders ignore the labels or units, it would make the chart confusing. So, it is necessary to mark what the axes represent so the numbers have context.
- Cluttered Chart Layout: If the chart is stuffed with too many lines into one chart, it makes it unreadable. So the traders should stick to a few important lines or split the data into multiple charts.
- Misleading Scale Choices: The tweaked scales can distort the real trend, and using consistent, honest scaling, especially when comparing multiple charts, is important.
- Overlooking the Main Trend: The traders might keep focusing on tiny bumps instead of the overall direction, which could lead to wrong calls. They should always read the bigger movement of the line.
Bottom line
The line chart cuts through the market noise and shows the true direction by focusing on closing prices. It helps the traders to read trends, spot support and resistance zones, and confirm breakouts with clarity.
When the line chart is paired with moving averages and trendlines, it becomes a steady guide for both intraday and swing analysis, while making decision-making sharper and more structured.
FAQ‘s
The line chart shows the closing price of an asset over time, and connecting these closing points highlights the main trend while filtering out intraday fluctuations. This makes it easier to understand the market’s overall direction and identify turning zones.
A line chart uses only closing prices to provide a clear view of the trend. A candlestick chart shows open, high, low, and close, which reveals the full price movement and intraday swings. The line chart focuses on clarity, while candlesticks offer detailed price action.
It depends on the trading style. A line chart works better for trend analysis, support-resistance zones, and reducing noise. The candlesticks work for pattern recognition and short-term trading where intraday highs and lows matter. The traders usually use both of these together for a better context.
In order to read a line chart, the traders need to follow the closing-price line to trace whether the market is rising, falling, or moving sideways. Next, look for repeated turning points to spot support and resistance. And then check if the price holds above or below these levels to judge strength, trend shifts, or potential breakouts.
The closing prices reflect where the market finally settled, making them more meaningful than the short intraday spikes. They show real conviction from buyers and sellers, create cleaner trends, and help in identifying breakouts or reversals without any distortion from temporary volatility.