Technical trading involves the use of many tools, techniques, and patterns. One such visually compelling pattern is Candlestick. They are used to determine and predict future price movements, with intuitive attributes like color codes for bearish or bullish movements.
Candlestick patterns consist of a body and two thin lines on both sides – wicks. These are used to depict the highest and lowest points of the price movement throughout a trading day. Long wick candles signal a reversal in trading. This blog analyses the meaning, significance, and a comprehensive overview of long-wick candles.
What is a Long Wick Candle?
A Long wick candle is a candlestick pattern constituting an elongated shadow or a wick, with a relatively short body. It is regarded as a sign of the price of the stock reversing. This means the stock’s price could now move in the opposite direction, i.e, trend reversal.
What Does a Long Wick Indicate in Trading?
Essentially, long wick candles indicate high selling or buying pressure. Once long-wicks start forming, it can be deduced that there is strong price rejection in the asset’s price. In short, the wicks signify points of rejection.
This implies that the price could have moved to a different level, but was forced back by other players in the market, eg, buyers or sellers.
These points of rejection could also serve as probable entry and exit points.. The longer the wick, the stronger the sign of rejection.
Long Upper Wick vs Long Lower Wick
Typically, two types of long-wick candles can be observed:
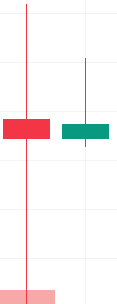
- Long Upper Wick: This pattern emerges when the body of the candle is at the bottom, with a long wick on top. It signifies that the buyers pushed up the price of the stock near its peak throughout the trading session. However, sellers step in and ensure a lower closing price.
- Long Lower Wick: If the long wick is formed below the body of the candle, it implies the sellers largely dominated the trading session; however, the buyers stepped in and pushed the price to a higher closing price. In general, these are observed during a downward trend and could be taken as a bullish sign.
How to identify Long Wick Candles on a Chart?
To identify long wick candles in a trading chart:
- Look for candles with a relatively small body and a long wick above/below it. Candles nearby may have disproportionately shorter wicks.
- The length of the wick is notably longer than its body.
- Check whether the long wicks form near the corresponding support and resistance sections to confirm rejection levels.
How to Trade Long Wick Candles?
Traders use long wick candles mainly for short-term trading. Once a long wick candle is spotted, one can effectively use the following strategies:
- If it has a long upper wick, selling pressure dominates at the end of the trading session. It usually appears during a market uptrend and may signal the reversal towards a downward direction. This is called a ‘bearish reversal’. Accordingly, one can sell or take a short position in the stock during this phase.
- If a candle has a long lower wick, it shows that buyers in the end, gained control of the trading session. This pattern typically appears after a market downtrend and could point towards a bullish reversal. Ideally, traders should consider buying or taking a long position in the stock during this phase.
- However, any entry/exit point must be evaluated in conjunction with the prevailing market conditions and sentiments.
- Additionally, set up stop-loss orders around the extremes of the wick, as a protection in case the market does not reverse.
Best Indicators to Confirm a Long Wick Candle- EMA, RSI, Volume Spikes
As a trader, you could use the following indicators alongside to validate the long wick candles.
- Exponential Moving Average (EMA)– The EMA helps traders align their trades with the overall price trend rather than pinpointing exact entry or exit points. It analyses the average price of a security over a specified time frame, giving more weight to recent data. This makes it a useful tool for confirming the market’s trend direction.
How to validate a Long Wick Candle? Suppose you spot a candle with a long lower wick around the zone of a rising EMA, you can use this as a confirmation of buying pressure. - Relative Strength Index (RSI)– The RSI indicator measures the magnitude of a price movement in a given period, assigning it a value between 1 to 100. Generally, a level above 70 highlights overbought zones, and a level below 30 represents an oversold zone.
How to validate Long Wick Candle using RSI? If a long wick candle appears in the overbought zone, i.e, above RSI 70, it further confirms the bullish reversal. - Volume Analysis – Volume analysis assesses the number of securities traded over a specific timeframe to understand the direction of the trend.
How does it confirm the Long Wick Candle? If you spot a long lower wick candle, and there are high buying volumes alongside, it may further validate the bullish reversal.
Best Timeframes for Long Wick Candles
Timeframes for different traders depend on their trading horizon.
- Day traders/Scalpers: These traders try to capture small price movements that occur within seconds or minutes. For them, the ideal timeframe to analyse a long wick candle strategy is between 5- and 15-minute charts.
- Swing traders: These traders hold their positions for longer than a day, sometimes overnight or for several weeks. Their ideal timeframe for using long wick candles is typically between 1- and 4-hour charts.
- Position/Long-term traders: These traders may have a longer holding horizon, such as more than a year. This makes daily or weekly charts more suitable for their long wick candle analysis.
When do Long Wick Candles Fail?
While long wick candles are an effective tool used by traders, there are times when their analysis might fail. Let’s check out some cases when this happens.
- Low liquidity markets: Suppose the given asset/stock is in a thinly traded market, with typically low trade volumes. A large one-off order may lead to the formation of such long wick candles, which may not be an actual reversal signal.
- High volatility: In highly volatile markets, long wick candles may not work as they may appear more frequently and could be false signals.
- No clear trend: These long-wick candles are prominent and reliable when the markets have a clear preceding trend. Without a trend, they may just be false signals.
- Other indicators don’t work: It may not be indicative of a clear reversal signal when other indicators do not support the long wick candles.
Related Candlestick Patterns
Some similar patterns from candlestick analysis are as follows:
- Pin Bar: This pattern has a long wick on either side and a short one on the other side. It also helps identify a trend reversal. If the pin bar has a long lower wick, it shows a bullish reversal. Whereas, a long upper wick implies a bearish reversal.
- Hammer: When the candle has a small body on top and a long lower wick, it is called a hammer. These usually appear at the end of a downtrend, signalling a potential reversal towards the upside. These are considered bullish reversals.
- Shooting Star: Tilt a hammer upside down, and it’s a shooting star which has a small body at the bottom, and a long upper wick. These typically appear when an uptrend could be ending, signalling a bearish reversal.
- Hanging Man: This is visually like a hammer pattern, but may appear after an uptrend rather than a downtrend. This signals a potential bearish reversal.
Conclusion
To summarise, trading patterns like long wick candles are influential tools that help signal potential reversals in the market. However, validations through other indicators such as EMA, RSI, and volume analysis are important. Using candlestick analysis with other tools can be more helpful for traders.
FAQs
A long wick candle with a long upper wick often signals that sellers eventually dominated the trading session, and therefore implies a bearish reversal. However, one with a long lower wick is indicative of a bullish reversal.
The timeframe for long-wick candles depends on the type of traders. Day traders/ scalpers may prefer a 5 to 15-minute chart. Swing traders may analyse 1 to 4-hour charts. Whereas long-term traders could go for daily or weekly charts.
A candlestick consists of a rectangular color-coded body and two thin lines on either side. These thin lines are the wicks of the candlestick. A significantly longer wick as compared to the body of the candle is called a long wick.
To confirm long wick signals, check other indicators such as Exponential Moving Average (EMA), Relative Strength Index (RSI), and Volume Analysis to validate the reversal.
Long wick candles are powerful tools that help traders identify a potential trend reversal. Their reliability, however, depends on the confirmation from other indicators and tools. Once the signals are validated, traders can determine entry and exit points, along with safeguarding themselves through stop-loss orders.