
Most of the time, timing a breakout is often the difference between a winning trade and watching profits slip away. Market moves can happen quickly, often before most traders react. Without a clear system, it’s easy to chase after moves that have already peaked or fall for false signals. That’s where momentum trading comes in, it focuses on real market strength by tracking signals like rising volume, price acceleration, and relative strength.
This approach helps traders enter while momentum is building, not after it fades. No wonder, in 2024, JP Morgan reported that momentum systems made up over 28% of institutional trading gains. In this blog, we’ll discuss how to use momentum trading strategies to build high-probability setups, and apply them across different market conditions for consistent results.
What are momentum trading strategies?
Momentum trading is a strategy that tries to make a profit by following existing market trends. The core idea is simple: assets that are performing well (winners) will likely continue to rise, while assets that are performing poorly (losers) will likely continue to fall.
Traders using this method buy stocks with strong upward price movement and sell or bet against stocks with strong downward price movement. This strategy doesn’t focus on the company’s actual value; it only cares about the strength and direction of the price. The main rule is to follow the trend, based on the belief that “the trend is your friend.”
Types of momentum strategies
There are several types of momentum trading approaches, which include:
- Relative
Relative momentum compares an asset’s price performance against that of another asset or a benchmark. This comparison is typically represented through a relative strength ratio, formed by dividing the value of one asset against that of another. A rising ratio indicates that the primary asset is outperforming, while a falling one suggests it is underperforming.
Traders use this strategy to identify the strongest assets within a group. The approach involves buying the securities that showcase superior relative performance and selling or avoiding those that show relative weakness, operating on the expectation that these trends will persist.
- Absolute
Absolute momentum, or time-series momentum, evaluates the performance of a single asset against its own past performance. Unlike relative momentum, it doesn’t compare the asset to others. Instead, it looks at an asset’s trend in isolation. The core rule is to buy an asset if its current price is higher than a certain past price (e.g., its price from 12 months ago) and to sell or move to a risk-free asset if its current price is lower.
It provides a built-in risk management feature; if the asset’s trend turns negative, the strategy signals an exit, helping to avoid significant drawdowns during bear markets. It essentially acts as a trend-following filter, participating in an asset’s uptrend and stepping aside during its downtrend.
- Cross Asset
Cross-asset momentum is a broader strategy that applies the principles of momentum across different asset classes, such as equities, bonds, commodities, and currencies. The idea is that patterns may continue not just inside one asset group but also across the comparative performance of multiple categories.
For example, a trader might observe that equities are showing stronger momentum than bonds. They would then allocate more capital to the equity market.
This strategy can be implemented using either relative or absolute momentum principles. It allows for diversification and the potential to capture major macroeconomic trends as capital flows from one asset class to another based on prevailing economic conditions and market sentiment.
- Sector
A sector momentum strategy is a specialised form of relative momentum that focuses on different sectors or industries within the equity market. The idea is that certain sectors will outperform others due to economic cycles, technological shifts, or other factors. A trader employing this strategy would analyse the performance of various market sectors (e.g., technology, healthcare, financials, energy) and invest in the sectors showing the strongest upward momentum.
This method can be applied by putting funds into sector-focused ETFs or a mix of top stocks from the best-performing sectors. It allows traders to concentrate their investments in the most robust areas of the market, potentially leading to higher returns than a broad market index.
- Breakout
The breakout momentum strategy is focused on identifying assets whose prices are moving beyond a previously defined trading range, such as a period of consolidation or a chart pattern like a triangle or rectangle. A breakout takes place when the price crosses above resistance or drops under support, usually alongside a notable jump in trading volume. This price action is viewed as the start of a fresh direction following the breakout path.
Traders using this method will enter a long position after an upside breakout or a short position after a downside breakout, placing a stop-loss order just outside the previous range to manage risk. This is one of the more popular momentum indicator strategies as it provides clear entry and exit points.
Indicator-based strategies
Common momentum indicator strategies are:
- RSI
The Relative Strength Index (RSI) is a technical oscillator that tracks the rate and magnitude of price shifts. It fluctuates within a range of 0 to 100. Generally, an asset is viewed as overbought once the RSI exceeds 70, and as oversold when it falls under 30. In momentum trading, the RSI can be used to identify the strength of a trend.
A reading that stays in the overbought territory during an uptrend can suggest strong momentum. In the chart of Reliance Industries below, you can see how buy signals from a momentum strategy often appear as the RSI crosses above its moving average and trends upward, indicating that positive momentum is building.
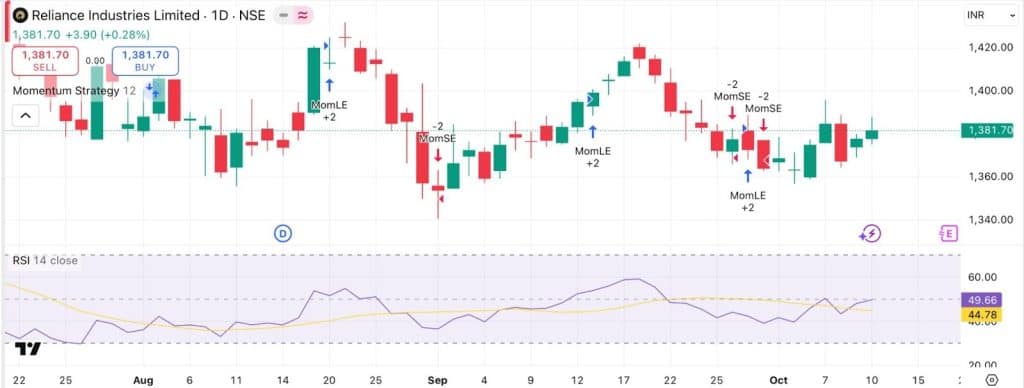
On the other hand, an RSI that remains in the oversold territory during a downtrend can indicate sustained negative momentum.
- MACD
The MACD is a momentum-based indicator that follows trends by illustrating the relationship between two moving averages of a price. Its formation involves three main parts, the MACD line, a signal line, and a histogram component. When the MACD line moves above the signal line, it’s taken as a bullish indication showing that upward strength is building.
Whereas, when the MACD line drops below the signal line, it provides a bearish signal, suggesting downward momentum is gaining strength. The histogram quantifies the separation between these lines, expanding as momentum increases.
- ROC
The ROC is a pure momentum oscillator that quantifies the percentage variation in price from a current point to a specific prior period. When a security’s price moves higher, the ROC will display a positive figure; if the price falls, the ROC will show a negative one.
For tracking momentum, a rising ROC value suggests the velocity of the uptrend is picking up. A declining ROC, even if its value remains positive, signals that the upward trend’s force is diminishing, alerting traders to a potential loss of strength.
- Volume Price Movement
Price tells you what is happening, but volume tells you how many people agree. Think of volume as the level of market participation that confirms a price move. A price rally on high and increasing volume shows that a large part of the market supports the upward trend, which gives the move conviction and legitimacy. This is a solid evidence of sustained price strength.
However, if an asset’s price is climbing but the volume is low or declining, it’s a major red flag. This suggests a lack of broad interest and conviction, making the trend weak and vulnerable to a quick reversal. Momentum traders always look for price and volume to move in harmony to validate a trade signal.
Advanced setups: divergence, scalping, overbought/oversold tactics
Advanced momentum setups used by traders are as follows:
- Divergence
Divergence signals a conflict between price and momentum, often warning of a trend’s end. Bearish divergence appears when prices hit a new high, but a momentum indicator fails to follow, creating a lower high. This hints that buying power is drying up.
In contrast, bullish divergence occurs when price makes a new low while the indicator forms a higher low, suggesting selling pressure is exhausted.
The chart below for Reliance Industries provides a clear example. The “Momentum Divergence Signal” indicator identified a potential top with a “Sell” signal and a potential bottom with a “Buy” signal, illustrating how this concept is applied in practice.
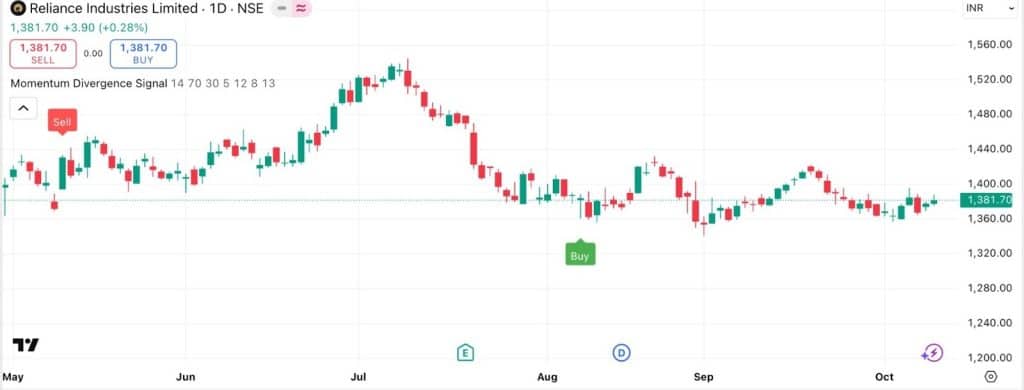
This disagreement is a powerful indication that the prevailing trend is losing its underlying strength and may be about to reverse.
- Scalping
Scalping is a high-speed strategy focused on capturing small profits from brief bursts of momentum. Using very short timeframes, like one-minute charts, scalpers execute a large number of trades to make incremental gains. The philosophy is not to ride a long trend but to exploit minor, predictable price movements in highly liquid assets.
This method demands extreme discipline, rapid execution, and an effective system for managing the high volume of “in-and-out” trades, where small wins are compounded over the course of a day.
- Overbought
An overbought signal (like an RSI above 70) is often a sign of strength for a momentum trader. Instead of signaling a reversal, it can confirm a powerful and sustained uptrend. A strong asset can remain “overbought” for a long time as it continues to climb. The strategy is to hold the position and ride the powerful trend. The actual sell signal is not when the asset enters the overbought zone, but when it finally falls out of it, indicating momentum is truly fading.
- Oversold
Similarly, an “oversold” condition is viewed by momentum traders as evidence of a strong, persistent downtrend. Rather than being an automatic buy signal, an indicator like the RSI dipping below 30 confirms that selling pressure is intense and in firm control. For traders holding a short position, this is a powerful validation of their bearish outlook, encouraging them to stay in the trade to capture further downside.
The asset can remain pinned in this oversold state for a considerable time during a steep decline. The trigger to cover the short and take profits only comes when the indicator finally begins to climb out of the oversold zone.
Conclusion
The principles outlined in this guide are your foundation, but remember that financial markets are not static. A strategy that thrives in a high-volatility, trending market may falter when conditions become quiet and range-bound. The most effective traders are the ones who know how to adjust with changing market conditions. They regularly test, improve, and fine-tune their momentum trading strategies to align with the existing market conditions. Think of this as the beginning of an ongoing process of learning and evolution, where your ability to adapt will be your greatest asset.
FAQ‘s
Momentum trading includes relative momentum, focusing on outperforming assets; absolute momentum, tracking an asset’s own price history; sector momentum targeting leading industries; breakout strategies identifying price moves beyond resistance/support; and indicator-based methods using tools like RSI, MACD, and ROC.
Top momentum indicators are the Relative Strength Index (RSI), which signals overbought or oversold conditions; Moving Average Convergence Divergence (MACD), showing trend direction and strength; and Rate of Change (ROC), measuring the speed of price movement. Volume confirmation bolsters signal validity.
Protect against momentum crashes by using stop-loss orders, diversifying trades, and avoiding over-leveraging. Watch for volume declines and momentum divergences as early signs of reversal. Exiting promptly when momentum fades or market sentiment shifts reduces risk of heavy losses in sudden crashes.
Momentum trading can be automated with AI, which processes vast market data to identify trends and execute trades based on preset criteria. AI minimised emotional bias, increases speed and accuracy of trade decisions, and can adapt strategies dynamically as market conditions evolve.
Momentum trading carries significant risks for beginners due to its fast pace and high volatility. Lack of experience may lead to late entries, poor stop-loss discipline, and emotional decisions. Beginners should learn gradually, focus on risk management, and consider simulation before live trading to minimise losses.