A chart can look perfectly normal until one detail throws traders off, a sharp drop followed by a tiny candle that refuses to give direction, creating a pause no one knows how to read. The morning star pattern helps decode this exact kind of chart “stall” by signalling when buyers are quietly stepping back in. In fact, research analysing historical candlestick formations shows these pattern setups deliver about 60-70% successful reversals when confirmed with volume. In this blog, we will discuss how to spot and interpret the morning star helping you make your trades better.
What is the Morning Star Candlestick Pattern?
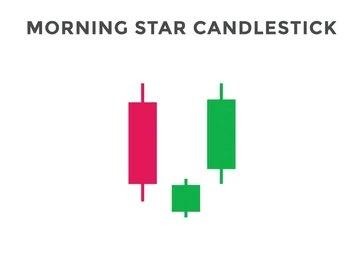
The morning star is a bullish reversal three candlestick pattern that typically appears at the bottom of a downtrend. It signals a possible modification in market sentiment from bearish to bullish, showing that sellers are losing influence, giving buyers the upper hand. The formation consists of a long bearish candle, a small-bodied middle candle indicating indecision, and a long bullish confirmation candle. Traders use this technical indicator to pinpoint suitable areas to enter a trade for long positions or to exit short trades.
How to Identify a Morning Star: Step-by-Step
identifying this pattern involves observing specific characteristics regarding structure, timeframes, and confirmation signals as follows:
- Structure & Appearance of the Morning Star
The formation appears over a stretch of three successive market days.
- Candle 1 (the bearish drive): The first candle must be a long, red (or black) body that aligns with the existing downtrend. This confirms that sellers are still in control and driving prices lower.
- Candle 2 (the star/indecision): The second candle has a small body (either red or green) and ideally gaps down from the first candle’s close. This small candle, often a Doji or Spinning Top, represents a moment of market indecision where neither bulls nor bears have dominance. The long lower shadow often seen here indicates that sellers tried to push lower but failed.
- Candle 3 (the bullish reversal): A large green(or white) candle forms last, beginning with an upward gap over the second candle’s close. Crucially, it must close significantly into the body of the first candle, typically at least halfway (above the 50% mark). This confirms that buyers have overwhelmed the sellers.
- Time-frames: daily, intraday, weekly
The morning star pattern is effective across various time frames, though its significance varies.
- Weekly chart: On weekly charts, the pattern is considered highly reliable as it represents a major shift in sentiment over a prolonged period, often signaling long-term reversals.
- Daily charts: This is the most common time frame for swing traders. A Morning Star here offers a balanced view of reversal potential without the noise of shorter periods.
- Intraday (15-min, 1-hour): Day traders use this pattern for quick reversals. However, false signals are more common on these shorter time frames, necessitating tighter risk management.
- Confirmation Signals (volume, support, indicators)
Analysts typically avoid using this pattern alone without supporting signals. Volume is a key confirmation tool; volume typically decreases on the first candle and the star, but increases significantly on the third bullish candle, showing strong buying interest. Additionally, the pattern carries more weight if it develops around familiar support levels or important averages. Indicators like the Relative Strength Index (RSI) are also checked; if the RSI is in the oversold territory (below 30) when the pattern forms, the probability of a reversal is often viewed as higher.
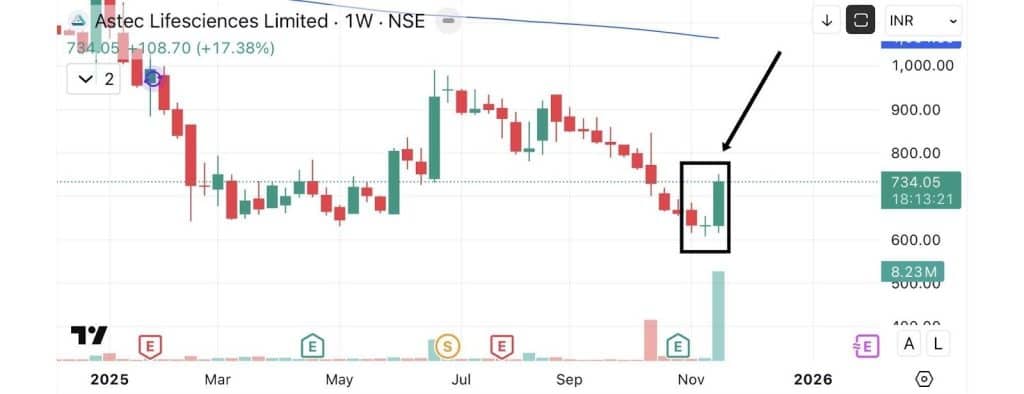
Now, let’s look at an example of the morning star pattern in the live market, the Astec Lifesciences Limited chart below, a Morning Star pattern formed in early November 2025. The marked area shows the classic three-candle reversal structure, validating a significant surge in volume supporting the third (green) reversal candle, adding strong confirmation to the pattern.
Morning Star vs Other Patterns
Learning how the morning star pattern differs from similar or opposite patterns helps in better clarity of the pattern. The morning star is a three-candle reversal pattern, while others may use fewer candles or signal the opposite direction. The differences between these patterns range across various factors such as:
- Morning Star vs Bullish Engulfing / Three White Soldiers
These formations fall under the broader idea of a bullish reversal candlestick pattern, but each differs in structure, visual layout, and the point at which the upward move is hinted.
| Feature | Morning star | Bullish engulfing | Three white soldiers |
| Candle count | Three candles. | Two candles. | Three candles. |
| Structure | Long red, small middle, long green. | Small red followed by a large green that covers it. | Three consecutive long green candles. |
| Trend signal | Reversal (bottom of downtrend). | Reversal (bottom of downtrend). | Continuation or strong reversal confirmation. |
| Buying logic | Shows indecision before a shift. | Shows an immediate, strong takeover by buyers. | Shows sustained, aggressive buying pressure. |
- Morning Star vs Evening Star
The evening star mirrors the morning star in reverse and develops under opposite market conditions. Here’s how they differ:
| Feature | Morning star | Evening star |
| Market Trend | Appears during a Downtrend. | Appears during an Uptrend. |
| Signal Type | Bullish Reversal (Price likely to go up). | Bearish Reversal (Price likely to go down). |
| First Candle | Long Bearish (Red). | Long Bullish (Green). |
| Third Candle | Long Bullish (closes back into the price area occupied by the first candle). | Long Bearish (closes back into the price area occupied by the first candle). |
| Psychology | Sellers exhausted, buyers taking over. | Buyers exhausted, sellers taking over. |
Practical Trading Strategy for Morning Star
Developing a strategy around this pattern requires thorough defined rules for entry, exit, and risk management which include:
- Entry Rules & Trigger
Patience is imperative when trading this pattern. Aggressive traders might enter a position near the close of the third candle if the volume is strong and the candle has clearly pushed past the midpoint of the first candle. A safer strategy is to let the following candle (the fourth candle) develop before entering. If the fourth candle breaks the highest point recorded by the third candle, a buy order is triggered. Some traders also wait for a retest of the “Star” support level before entering, although this retest does not always happen.
- Stop-loss & Target Setting
To protect capital, the stop-loss is generally positioned under the pattern’s bottommost level, which is the low of the middle “Star” candle. Should the price slip below this level, the reversal idea fails and the prior decline may resume. Traders typically base profit exits on nearby resistance areas, earlier highs, or important moving averages. Alternatively, a fixed risk-to-reward ratio (such as 1:2 or 1:3) can be applied, ensuring that the potential profit justifies the risk defined by the stop-loss distance.
- Risk Management & Trade Management
Since no pattern guarantees a profit, risk management is implemented to limit exposure. Position sizing is calculated so that a loss on the trade does not exceed a small percentage of total capital (e.g., 1-2%). As soon as price action pushes in the desired direction, some strategies involve moving the stop-loss to the break-even point to protect capital. This ensures that even if the reversal fails later, the trade does not result in a financial loss.
Advantages and Disadvantages of Morning Star Chart Pattern
Like all technical analysis tools, the morning star pattern has its strengths and weaknesses. It is a popular pattern because it is visual and logical, but it is not fool-proof. This pattern offers various pros and cons for traders such as:
Advantages
- Early signal: It provides an early indication that a downtrend is ending, allowing traders to enter a new trend near the bottom.
- Easy to spot: The visual structure of “long red, small star, long green” is distinct and relatively easy to identify on a chart compared to more complex patterns.
- Defined levels: The pattern provides clear price levels for setting stop-losses (below the star) and entry points, which simplifies planning the trade.
- Frequent occurrence: It appears regularly across various markets (stocks, forex, commodities) and timeframes.
Disadvantages
- Needs confirmation: The pattern alone is often not enough; trading it without checking volume or support levels can be risky.
- False signals: In a very strong downward trend, a Morning Star might just be a brief pause before the price continues to fall. This is known as a “failed signal.”
- Lag: Since it takes three candles to form, the price may have already moved up significantly by the time the signal is complete, reducing the likely profit margin compared to faster signals.
- Gap requirement: Ideally, the pattern has gaps between the candles. In modern continuous markets or highly active stocks, these gaps do not always occur, making “textbook” examples harder to find.
Common Mistakes of the Morning Star Pattern
Traders generally encounter pitfalls when interpreting this pattern that can lead to poor results, which include errors such as:
- Ignoring the prior trend: A frequent error is identifying a Morning Star pattern in a flat or sideways market. A strong drop in the market must come before the pattern for it to be recognised as genuine. Without selling pressure to reverse, the pattern has little predictive value.
- Premature entry: Entering a trade before the third candle has fully closed is risky. The market can shift in the final minutes of a session, changing a potential bullish candle into a bearish one, thus invalidating the signal.
- Overlooking volume: Relying solely on price shape without checking volume data reduces success rates. Low volume on the reversal candle indicates weak buyer commitment.
- Disregarding resistance: Buying on a Morning Star signal directly below a major resistance level is often avoided. Even if the pattern is valid, the price may hit the “ceiling” and bounce back down immediately.
- Forgetting the stop-loss: Because the pattern looks strong, some traders skip the stop-loss. If the pattern fails, this can lead to large, uncontrolled losses.
Conclusion
Chart analysis is a skill that develops through steady observation and time. The morning star pattern is just one component of this broader study. Viewing market behavior over a long period helps build a clearer understanding than looking at isolated events. Consistent practice assists in recognising how different elements work together. This creates a solid foundation for interpreting price movements in various conditions.
FAQs
The morning star is a three-candle bullish reversal pattern appearing at the bottom of a downtrend. It starts with a long bearish candle, followed by a
small-bodied indecision candle (star), and ends with a long bullish candle signaling buyers regaining control.
Trade the morning star by entering after the third bullish candle closes above the midpoint of the first candle, ideally confirmed by strong volume. Place a stop-loss just below the low of the middle “star” candle and set profit targets near resistance or based on risk-reward ratios.
The morning star signals a bullish reversal at downtrends’ bottom and consists of a bearish candle, a small indecision candle, and a bullish candle. The evening star signals bearish reversal at uptrends’ peak, with a bullish candle, indecision candle, and a bearish candle.
The morning star pattern is fairly reliable, delivering 60–70% successful bullish reversals when confirmed by volume and support levels. However, it
can give false signals in strong downtrends or without volume confirmation, so confirmation with additional indicators is advisable.
Set stop-loss just below the middle “star” candle’s low to limit losses. Profit targets are typically placed near previous resistance levels, swing highs, or according to a risk-reward ratio like 1:2 or 1:3, ensuring potential gains outweigh risks.
While most reliable on daily and weekly charts, the morning star can be used on intraday charts (like 15-minute or 1-hour). However, intraday signals may be less reliable due to market noise and require tighter risk controls.
Common mistakes include trading the pattern without confirmation, premature entry before the third candle closes, ignoring volume, neglecting nearby resistance, failing to set stop-losses, and applying the pattern without a preceding downtrend, all of which increase risk of loss.