Price movements often capture attention, but they rarely tell the entire story. Behind every breakout, trend, or reversal lies an important clue – volume. When both the price and volume are analysed together, it can determine whether a move is supported by market participation or not. This combination helps in interpreting the market behaviour more clearly and avoids relying on price signals alone.
In this article, we will understand how price and volume work together, and how this relationship can help in reading the market.
What is Price Volume Analysis
Price-volume analysis is the process of studying price movement together with trading volume to understand the strength behind market activity. Instead of looking only at the price, the volume is also considered to assess how much participation supports the move.
Markets often move in cycles such as accumulation, expansion, and distribution. The volume pattern can provide insight into whether buyers or sellers are gaining control.
Let’s see the price and volume on HDFC Bank’s chart during February 2026:
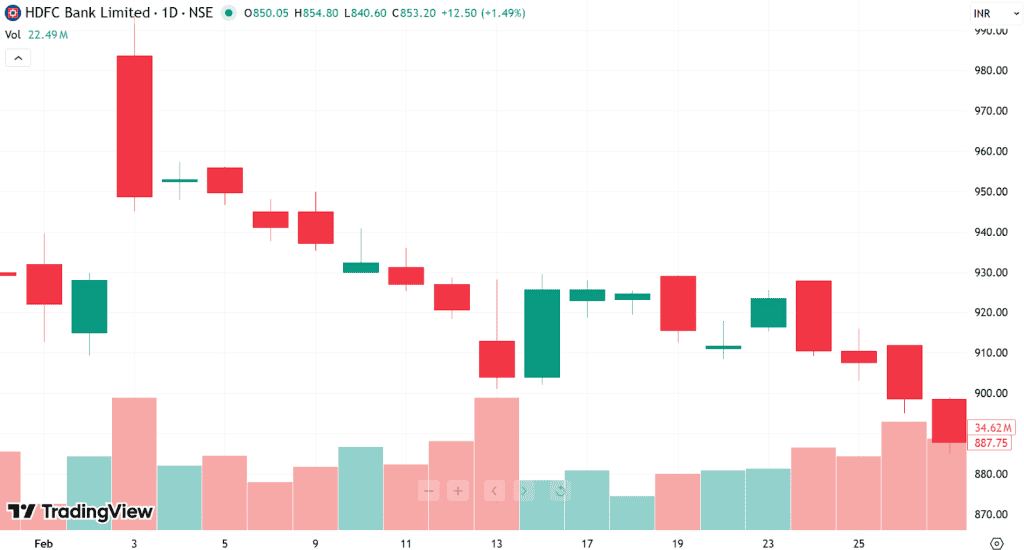
- On February 3, the price fell from ₹980 to ₹950 while the volume rose sharply to around 5 crore shares, indicating strong selling participation.
- On February 13, the price declined toward the ₹905–₹910 range, and the volume bars expanded, suggesting increased activity during the downward move.
- The price dropped further to around ₹887 on February 27, and the volume climbed to 3.462 crore shares, showing heightened participation in the late-stage decline.
Why price + volume together matters (trend strength)
Understanding market trends is one of the goals of technical analysis. While price charts show the direction, volume helps in determining the strength behind the move.
Those who follow price action trading rely on price patterns to interpret the market. However, when volume is added to their analysis, it provides confirmation that the move is supported by real participation.
Volume also plays a key role during breakouts. A breakout that occurs with strong volume is more reliable than one that happens during low trading activity.
The 4 core price–volume rules
Although markets can behave in complex ways, the relationship between price and volume often follows several recurring patterns. These patterns form the foundation of price-volume interpretation.
Price up + volume up (trend strength)
When the price is rising and the volume is increasing, it signals strong buying interest. The high trading activity shows more people are entering the market.
This pattern supports uptrend continuation. Traders often view this relationship as confirmation of market strength.
Price up + volume down (weakening / risk of reversal)
If the volume is declining while the price continues to soar higher, it indicates that an uptrend might be losing its strength. The reduction in participation shows that fewer traders are supporting the move.
Such situations appear during the later stages of a trend. Traders become cautious because the lack of volume increases the chances of a slowdown or possible reversal.
Price down + volume up (distribution / strong sell pressure)
When the prices decline while the volume expands, it reflects higher selling pressure. The rise in activity means more participants are actively selling, accelerating the downward movement in the market.
This combination appears when the market sentiment is negative. As more traders exit their positions, the prices plummet further and add to the bearish movement.
Price down + volume down (selling pressure fading)
When both the price and volume fall together, it means that sellers are getting weaker. Although the market is still moving downward, the reduced trading activity suggests that fewer participants are actively selling.
This situation is seen when a downtrend begins to lose its momentum. As selling activity slows, the market may stabilise before the next significant move.
How to do Price Volume Analysis
Price-volume analysis follows a structured approach. By observing price behaviour, key levels, and volume changes, we can interpret trend strength and market participation.
Step 1: Choose a timeframe + match volume to it
The first step is to choose a timeframe that matches your trading strategy. The volume can behave differently across timeframes, and its correct interpretation depends on the context of the chart being analysed.
Intraday traders may use minute or hourly charts. Swing traders or long-term investors are better off with daily or weekly charts. You can also use a multi-timeframe analysis to compare volume behaviour across different charts.
Step 2: Mark key levels first
Before analysing the volume, identify the important price zones where market reactions are likely to occur. These areas represent previous turning points where buyers or sellers entered the market.
The key levels – support and resistance provide context for price movement. Observing how prices behave around these areas helps in determining whether the trend will hold or not.
Step 3: Compare to the average volume
The volume becomes more meaningful when it is compared with previous trading activity. We need to check whether the current volume is higher or lower than the recent average.
An increase in the trading volume signals heightened market interest from the participants. A declining volume may indicate weaker participation and reduced momentum.
Step 4: Read candle spread + close with volume
The relationship between candle size and volume can offer additional insight into market behaviour. Larger candles supported by higher volume indicate stronger buying or selling pressure. On the other hand, smaller candles with low volume suggest indecision in the market.
When we study the spread alongside candlestick patterns, it helps in interpreting how buyers and sellers are interacting in each trading session.
High-probability setups
Price and volume patterns can highlight situations where market moves have stronger participation. There are some setups with higher chances of yielding favourable outcomes often used by traders.
Breakout Validation: real breakout vs fakeout
A breakout happens when the price moves significantly beyond a key support or resistance level. Volume helps in deciding whether the breakout is real or a false one (fakeout).
In a breakout trading strategy, higher trading activity during the breakout is often seen as confirmation that the move has strong backing.
Example: A stock repeatedly faces resistance near ₹500. If the price breaks to ₹515 while activity rises from 8 lakh to 20 lakh shares, the breakout appears stronger. But a move to ₹505 with activity falling to 5 lakh shares may signal a weaker breakout or fakeout.
Trend Continuation
Volume also helps in understanding whether a trend will last or not. A pause means that the market is going through a brief period of stabilisation before the next move. Evaluating whether trading activity has increased again after the price resumes is an essential step for those following a trend trading strategy.
Example: The shares of ABC Ltd. rise from ₹700 to ₹760, followed by a pullback to ₹740. Then the price later climbs to ₹770, and trading activity increases from 9 lakh shares to 18 lakh shares. The renewed participation suggests that the trend is continuing.
Reversal Signals
Reversal signals appear when a trend begins losing strength and the buyer-seller balance changes. Declining volume in a trend, followed by increasing activity in the opposite direction, indicates a possible shift.
Example: Imagine a stock called XYZ climbing from ₹320 to ₹380 while volume falls from 15 lakh shares to 7 lakh shares. If the price then drops to ₹350 while volume jumps to 20 lakh shares, the surge in selling activity reflects a potential change in direction.
Divergence
When the price and trading volume move in opposite directions, this situation is called a divergence. While the price may increase or decrease, the participation keeps falling, suggesting a weakening of the trend.
Example: Suppose a stock climbs from ₹420 to ₹460 while trading activity declines from 12 lakh to 5 lakh shares. The rising price with falling volume indicates possible divergence.
Volume-by-price analysis
Another powerful way to interpret trading activity is through the volume profile indicator or volume-by-price analysis.
Unlike traditional volume bars that show activity over time, volume-by-price analysis displays trading activity at specific price levels. Price zones with high trading activity often act as strong support or resistance levels, as many traders have previously entered positions here.
By studying these areas, traders can better understand where market participants are likely to react in the future. Volume-by-price analysis, therefore, provides a deeper view of market structure beyond simple price charts.
Tools for price-volume analysis
While price and volume charts already provide valuable information, there exist indicators that can help in the interpretation of volume patterns more clearly.
VWAP
The Volume Weighted Average Price (VWAP) Indicator calculates the average price of a security weighted by volume throughout the trading session. It helps in understanding the average level at which most trading activity has occurred.
When the price remains above VWAP, it suggests buying interest and positive momentum. If the price stays below it, the market reflects a weaker sentiment or sustained selling pressure.
OBV
On-balance volume (OBV) measures the total market participation. It works by adding volume on up days and subtracting volume on down days. OBV aids in detecting whether volume is flowing into or out of a security.
If the OBV moves upward along with the price, it confirms the trend strength. However, if OBV begins to move away from the price, it indicates weakening momentum or potential divergence.
Conclusion
Price-volume analysis helps in interpreting the market behaviour. By observing the relationship between price and volume, we get more context about the trend. When the price volume analysis is utilised with key levels and chart patterns, we get a more holistic view of the market. Understanding how they interact can make your analysis more structured and informed.
FAQs
Price-volume analysis examines how price movements relate to trading activity. By observing both together, it becomes easier to understand whether a market move has strong participation behind it or whether the momentum may weaken.
Volume confirms a trend when it rises along with price, showing stronger participation in the move. When volume declines during a trend or moves differently from price, it may signal a possible reversal.
Rising price with falling volume may indicate weakening demand behind the move. Although prices are increasing, the reduced participation can suggest fading momentum and may raise the likelihood of consolidation or a reversal.
A breakout is generally considered stronger when it occurs with noticeably higher trading activity than the recent average volume. Increased participation suggests broader market support, which makes the breakout more reliable.
Volume-by-price analysis, also known as the Volume Profile, displays trading activity at specific price levels instead of time intervals. It helps identify areas where significant buying or selling occurred, which may act as future support or resistance.