
In trading, it is essential to see a pattern at the opportune moment to make a successful trade. Pullback trading strategy is a typical way to join the market with a better risk-reward ratio. Pullbacks enable traders to get into a trade at temporary price reversals in a larger trend, as opposed to breakout chasing or attempting to capture highs and lows. This blog article discusses the nature of pullbacks, various types, how to trade pullbacks successfully, and the best tools and risk management strategies to trade them profitably.
What is a Pullback in Trading?
A pullback is a strategy where traders buy during a temporary halt or correction of price drops within a prevailing uptrend or downtrend. Among other changes, instead of the price direction being strictly up or down, corrections are normal, and there should be a pullback in the price and then a resumption in its previous direction.
As an illustration in technical analysis, during an uptrend, a pullback may appear as a minor pullback or sideways motion, which gives traders an opportunity to enter the trend at a better price. Pullbacks contrast with trend reversals because they indicate retracement instead of trend reversal direction.
How the Pullback Trading Strategy Works
The pullback trading strategy involves identifying small reversals in a trend and trading when the price reverts to its initial level. It is hoped that the strategy can purchase low in an uptrend pullback or sell high in a downtrend pullback, which maximises the profit opportunity and minimises the downside risk.
Traders hold off buying or selling until they can see a signal, such as a price moving bounced out of the support, the trendlines, or important moving averages. Pullback entries typically translate to a smaller stop loss and more defined risk-reward structures, and hence, this strategy is loved by novices and professionals alike.
Types of Pullbacks
There are different kinds of pullbacks formed depending on their depth, time, and price affairs. The knowledge of the kind of pullback will help a trader determine how to trade it better.
- Shallow Pullbacks
They are shallow pullbacks whereby a price retracement is less than 38% of the prior trend leg. They tend to be temporary and frequently present during robust health trends. The shallow pullbacks are seen as robust since buyers or sellers rush back in.
- Deep Pullbacks
Deep pullbacks retrace 38%-61.8% of the previous move. These are more corrections, but they are within a trending market. The deep pullbacks may provide superior entry points, yet they carry a slightly elevated risk of reversal if the correction exceeds the usual magnitude.
- Complex Pullbacks
Complex pullbacks are characterised by extended sideways or choppy price movements, marked by several small highs and lows. These pullbacks may take one or more days or weeks and are less easy to trade because they are unpredictable. Complex pullbacks can be tricky to break out, and in a lot of cases, traders will wait until there are indicators of breakouts before jumping in.
Example of Pullback
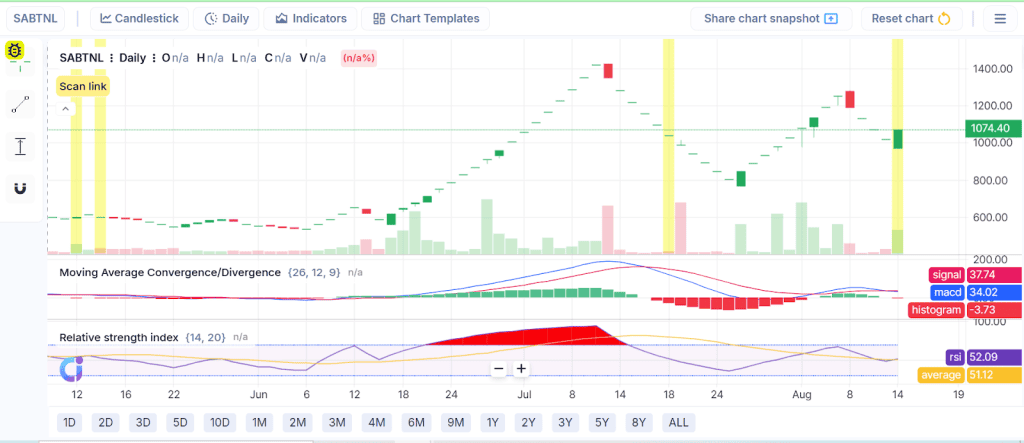
As you can see in the above chart, the stock experienced selling pressure, causing a fall from its top, following a strong rise from late June to mid-July, when prices went rapidly upward. Midway through July, there was a decline that was indicated by a series of red candles and a slowdown in the momentum of the MACD histogram.
This suggests that there may be a temporary correction inside the larger uptrend. It seems like the price has stabilised and is trying to rebound after this dip, which might mean that it will continue if purchasing pressure comes back.
Best Indicators for Pullback Trading
Certain technical indicators help identify and confirm pullbacks, making them valuable tools for traders.
- Moving Averages
The use of moving averages enables the smoothing of price data, allowing traders to determine the direction of the trend and identify dynamic support/resistance. Popularly used MAs, such as the 20-day and 50-day, are used as pullback areas where the price will either be found at support or resistance and continue the trend.
- Fibonacci Retracement
The use of Fibonacci retracement levels (23.6%, 38.2%, 50%, 61.8%) to identify possible pullback targets in trends is a common practice. The traders closely observe these levels, and they are also normally confronted with price reverses in the course of pullbacks.
- Trendlines
Visual confirmation should be made on pullback areas by observing set on direction trendlines that have merged and in an uptrend have ascending lows, or, in a downtrend, declining highs. A bounce in price off of these trendlines, showing a reprieve or a pullback, could also be a signal that the trend will continue.
Pullback vs Reversal: Key Differences
Although pullbacks and reversals are both instances where the price exchanges hands against the current trend, the difference in meaning is noticeable:
- Pullbacks are temporary corrections within a trend, often followed by continuation.
- Reversals indicate a change in the overall trend direction, signalling potential exits or new entries in the opposite direction.
It is important to know that a price dip involved in the pull and the reversal is important so as not to lose results in wrongful trades.
Popular Pullback Trading Strategies
- EMA Pullback Strategy
This pullback trading strategy implements exponential moving averages (EMAs), such as 9 or 21 EMAs, to define pullback zones. Whenever traders see the price retrace to a certain EMA, they are waiting to see the price bounce back and enter into a trade that continues the trend.
- Trendline Pullback Strategy
Trendline pullback is a strategy by drawing the trendlines on the chart, traders anticipate the price to reverse and hit the trendline. When there is a bounce off the trendline and confirmation (e.g., bullish candlestick patterns), there is a good entry.
- Fibonacci Pullback Strategy
The traders use the Fibonacci retracement on the most recent leg of the trend and seek periods of pullback to the major Fibonacci levels. When price signs a reversal at these price levels, entry is signalled.
Risk Management for Pullback Trades
Proper risk management is vital to succeed with pullback trading strategy
Position Sizing
Determine the size of your positions using your total capital and risk tolerance, aiming to risk no more than 1-2% of the account per trade.
Stop Loss and Risk Control
Put stop loss orders right above the pullback low in an uptrend or above the pullback high in a downtrend to minimise the loss pending the pullback turns into a reversal. Attach stop loss altering as the deal proceeds, all in your favour.
Advantages of Pullback Strategy
- Increases access to low-risk entry, unlike trying to capture breakouts or trading out of the tops or bottoms, so the chances of paying too much are reduced.
- Offers a more favourable risk-to-reward ratio as traders can get in during price retracements and be nearer to the supports.
- Performs well in strong pullback trading strategy markets and in conditions that are not excessively volatile, having flexibility in various situations.
- Compatible with multiple timeframes and asset classes, from intraday charts to long-term investing, making it adaptable for various trading styles.
Limitations of Pullback Strategy
- There are cases when pullbacks turn into complete reversals, which cause false trade entries, and losses can occur.
- Irregular pullbacks having complex patterns are more difficult to recognise, and possibly higher technical skills are needed, and more patience is required.
- It requires patience to wait until it sees confirmation signals before getting in, and that is not easy in swift markets.
- Will not work in a non-trending /choppy market where there is no clearly indicated price movement, and can easily clear several stop losses.
Conclusion
Pullback trading strategy is an effective tool for trading on trends, offering low-risk entry at favourable prices. Knowledge of the possible withdrawal forms, the correct application of indicators, and appropriate risk management can significantly impact trading performance. Though there is no completely risk-free strategy, learning how to use pullbacks will provide a trader with a disciplined and well-organised method of trading that remains in line with the natural rhythm of markets.
FAQs
Taking into account your trading style will determine the most appropriate timeframe to use in a pullback trading strategy. Fast-traders (day traders) tend to use shorter (5-minute or 15-minute) charts as much as swing traders use longer (1-hour or on a daily chart) charts to trade overall moves. Position traders who favour longer timeframes, such as weeks or months, tend to use weekly charts. It is useful to find the primary trend on a larger time frame and trade on a slightly smaller one.
Yes, a pullback trading strategy can be used by a beginner, but then they should start with a simple setup and easy rules. The structured way by means of which pullbacks can be used to enter a trade is they are less risky to a novice trader, as when there is no pursuit of a price. A new trader should focus on identifying clear patterns, utilise simple indicators like moving averages, and wait for confirmation before entering the trade. Demo accounts can assist in gaining skill and confidence through practice.
A valid pullback is realized when the price moves contrary to the directional trend and then reverses itself back to the previous direction. The first step in identifying a trend is to confirm a strong underlying trend using tools like moving averages or trendlines. Next, seek a retracement that potentially honours the next support or resistance levels, which can be 38-61.8 per cent levels of the previous action on a Fibonacci scale. Volume can fall on the pullback and rise later when the trend has been resumed.
A pullback and a retracement are commonly used interchangeably, yet they have some minor distinctions. A pullback is a temporary pause or decline of an ongoing trend, which can give a trade entry position prior to a continuation of the trend. Any short- or long-term price reversal opposite to the prevailing trend is defined as a retracement. In effect, a pullback is simply a retracement, though not all retracements are considered to be pullbacks. Pullbacks are usually of a less intensive scope, and retracements are more profound and longer-term.
The pullback trading strategy has the best indicator, depending on your own trading style, but a moving average will suffice. They assist in identifying trend direction and potential buy areas during a pullback. And, as an example, the 20- or 50-period EMA provides moving support or resistance. Fibonacci retracement levels, along with RSI, serve as useful tools for identifying overbought and oversold areas, as well as analysing volume to prove price strength.