For options traders, understanding market signals is key to making profitable decisions. A sudden surge in open interest (OI) is one such powerful but frequently ignored signal. The shift like this may signal the expansion of interest in the market, the price fluctuations, or the entrance of major market entrants. But what should be the meaning of the sudden increase in OI? What are the ways in which traders can apply it to price and volume data? This blog explains all about the open interest, how to read up surges in open interest, and effective suggestions to trade the spurt in open interest.
What is Open Interest?
The number of unclosed market options or futures contracts is called open interest. It’s the number of open contracts in a security. As opposed to volume, which is the number of trades in a specified day, open interest is an indication of how many traders participated in the market over a certain period of time. Open Interest helps options traders estimate liquidity and trader interest by determining open contracts.
What Does a Spurt in Open Interest Mean?
The increase in open interest implies a sharp and notable rise in the quantity of open contracts. This tends to be indicative of new money in the market on the long or short side. It may reflect increasing confidence regarding a price movement in the future, increasing speculation, or institutional activity. Nevertheless, the spurt in open interest is not the whole picture; the context should be placed with price and volume to determine whether it is bullish, bearish, or neutral in option trading.
Causes of a Sudden Rise in Open Interest
News Events
Traders tend to make new positions when there is major news, earnings reports, government news, or other significant developments in a particular sector. This contributes to the making of more contracts, forcing the spurt in open interest upwards. This information is responded to by the market, which strengthens activity and OI as traders are increasing their hedge or speculating on movements.
Breakouts and Trend Confirmations
When the stock or index in question breaches one of the major support or resistance levels, traders rush in to take advantage of the direction. Increased open interest is seen in this surge of activity, which proves the breakout. OI spikes tend to give trend-followers assurance that the uptrend they seek to enter is strongly participated in and is likely to continue.
Large Institutional Positions
Institutions and hedge funds will likely open up large option positions on a hedging basis or even a speculative basis. Their entry into this market can lead to an upsurge in open interest on certain strike prices. Retail traders can selectively use these unusual OI increases to adjust strategies accordingly to counter the smart money.
How to Analyse a Spurt in Open Interest
Open Interest with Price Movement
Interpreting a spurt in open interest is incomplete without considering price changes. For example:
- OI and price both rising typically suggest new buying interest, a bullish signal.
- OI rising while price falls may indicate fresh short selling, bearish sentiment.
- OI decreasing with price rising or falling often means traders are closing positions, signalling a potential trend exhaustion.
Volume vs. Open Interest
The number of contracts transacted in a day is measured by volume, whereas the open contracts are measured by open interest. An increase in volume but no real increase in OI could indicate that there are simply traders liquidating and reopening positions. A surge in volume and an increase in OI, though, is normally an indication of new positions being taken which means more conviction.
OI Chart Examples
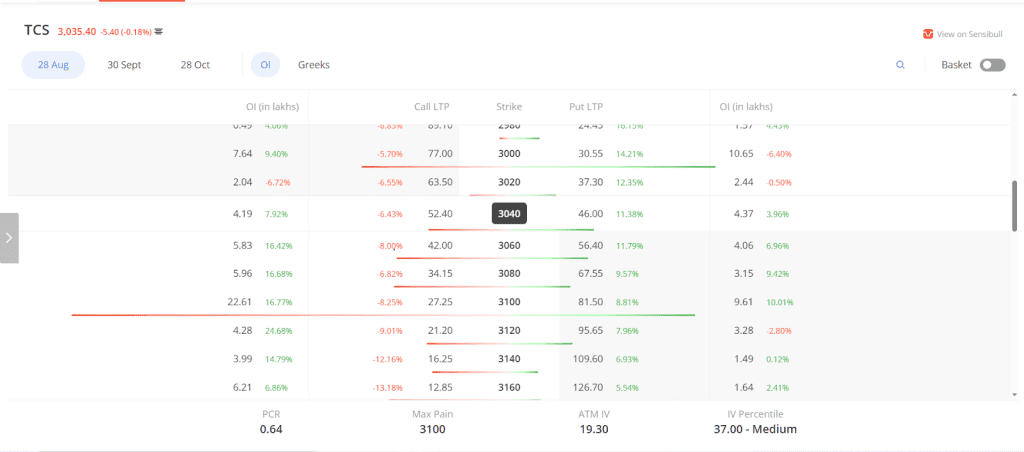
This chart displays the TCS option chain together with specific information regarding open interest (OI) at different strike prices. It is evident that there is a noticeable surge in OI around the 3100 strike price. With an OI of 22.61 lakh contracts, the call option at the 3100 strike has seen a notable increase of 16.77% from the previous session. This suggests that there is high buying activity or new positions being established at this level.
Put options on the 3100 strike have a large open interest of 9.61 lakh contracts, an increase of 10.01%, indicating significant activity and potential support. Increased market attention and possible price consolidation around this level are sometimes indicated by a simultaneous jump in open interest on both calls and options near the same strike price. This sudden increase in open interest can be seen by traders as a crucial area where prices could move, and they can use it to plan their entry or exit strategies according to market sentiment and volatility expectations.
Spurt in Open Interest: Bullish or Bearish?
A spurt in open interest can be bullish or bearish, depending on accompanying factors:
- If prices and OI rise together, it often indicates bullish interest with buyers entering.
- If prices fall while OI rises, it suggests bearish positions are being built.
- Rising prices with falling OI can indicate short covering, a bullish reversal.
- Falling prices with declining OI may signal profit-taking or position unwinding, possibly ending a downtrend.
The key is to combine OI with price action and volume for a clear picture.
How to Trade a Spurt in Open Interest
Entry and Exit Rules
- Entry: Seek a large OI increase that is followed by huge volume and price action. In bullish setups, enter when the price breaks the resistance with increasing OI. In the case of bearish setups, chances to go short on the occurrence of a break of support and an improvement in the OI.
- Exit: Place profit goals off of recent prices or technical marks such as moving averages. Exit when OI falls hard, indicating position unwinding. Never leave without stop losses in order to hedge against false signals or rapid turns.
Risk Management Tips
- Use stop losses based on volatility or ATR to limit downside.
- Avoid entering trades on OI changes alone; wait for confirmation from volume and price.
- Position size appropriately to avoid large losses if the market moves against you.
- Keep an eye on overall market trends and news to avoid surprises.
Pros and Cons of Using Open Interest Data
Pros
- The spurt in open interest provides valuable insights into market participation, extending beyond price and volume data. It indicates the number of contracts that are actively taken up, which shows the real commitment of the traders.
- It also helps traders verify whether the price movements are strong or weak, as it displays whether a trader is creating new positions or closing positions. Such attestation can enhance the quality of trade decisions.
- Open interest can spot huge institutional movements and possible block trades; it can provide what big market players are up to. Retail traders can follow such actions to track the smart money.
- It is a useful tool in a wide range of traded assets, including stocks, futures, and options. It is a useful investment as it is widely used by traders across markets.
Cons
- One should never consider buying or selling based on open interest alone, since without other indicators, it does not reveal good signals. Only OI may result in a wrong conclusion.
- Some markets exhibit less transparent open interest sources that are delayed, so analysis is difficult in real-time. This may affect the reliability and timeliness of the signal.
- Newcomers or inexperienced traders may misunderstand the moves in the open interest, leading to incorrect trading choices. OI has to be read with proper training and practice.
- The lack of effectiveness of spurt in open interest analysis occurs in very low liquidity markets where fewer contracts are traded, resulting in erratic or unclear signals. When that is the case, OI may make things riskier.
Conclusion
A surge in spurt in open interest can be a worthwhile indicator for options traders in the right context. It assists when pinpointing new positions, pinpointing breakouts, and in judging market sentiment. Nevertheless, using OI solely can be dangerous. Using price action, volume, and technical indicators together with open interest is a powerful way to trade more intelligently. Through disciplined risk management practice, OI surges can be utilized to good effect enabling traders to perform better when entering and exiting a trade.
FAQs
The decrease in open interest price usually signals a reduction in the number of traders that are taking positions. This may be a downside of profit-taking, liquidation, or tax avoidance, or a loss of confidence in the trend direction. It usually comes in when there is a large movement in price or an increase in ignorance in the market. Although this might imply losing steam, it all depends on the context. If the price goes down rapidly, accompanied by declining open interest, this might portray a reversal or the end of a trend.
The spurt in open interest values is also mostly dependable because exchange-reported contract positions provide them. But it would be useful only as long as markets are transparent and liquid. In such liquid markets as the NSE options and futures, OI acts as a good measure of participation in the market. OI can be more delayed or less accurate in less transparent or markets lacking liquidity.
No, an increase in open interest is not necessarily bullish. It merely means that new positions are required to be opened, but this can be either long or short. In order to identify bullishness, OI should be studied in relation to price movements. An increase in price accompanied by an increase in OI indicates bullish strength, whereas an increase in price accompanied by a decrease in OI indicates negativity, or bearish pressure.
Some of the best resources to monitor the spurt in open interest are platforms such as the official website of the NSE India, TradingView and Screener.in, where one can chart stocks, futures, and options open interest. There is also integrated OI tracking through the likes of the Zerodha Kite and Upstox Pro brokerage platforms. To go into more details, special programs such as Trendlyne, MarketGauge offer more detailed charts and OI data, and aid traders in combining them with other technical indicators.
OI spurts occur when there’s a sudden rise in the number of open futures or options contracts. They’re usually driven by fresh positions, short covering, or long unwinding during strong price moves or news events.
A surge in open interest means more traders are entering the market — either buying new contracts (bullish buildup) or selling them (bearish buildup). Rising OI with rising price = long buildup; rising OI with falling price = short buildup.
Tracking OI spurts helps identify where smart money is flowing. Stocks showing consistent price and OI increase may signal strength, while those with falling price but rising OI may indicate fresh shorts. It’s a key filter for short-term traders.
Visit the NSE India website → Market Data → Derivatives → Open Interest. You can also use tools like StockGro app, Moneycontrol, or GoCharting for real-time OI spurt tracking.