Understanding market trends doesn’t always need complex indicators. Sometimes, the price itself tells a story. Often, the price action itself reveals the narrative, and candlestick patterns are one of the most trustworthy methods to decipher this story. Across various patterns used in technical analysis, the Three Inside Up candle pattern is widely regarded as an important indicator, suggesting a shift in momentum, from bearish to bullish.
In this blog, we’ll break down the Three Inside Up candlestick pattern, how it forms, what it means, when to look for it, and how to use it in your trading strategy.
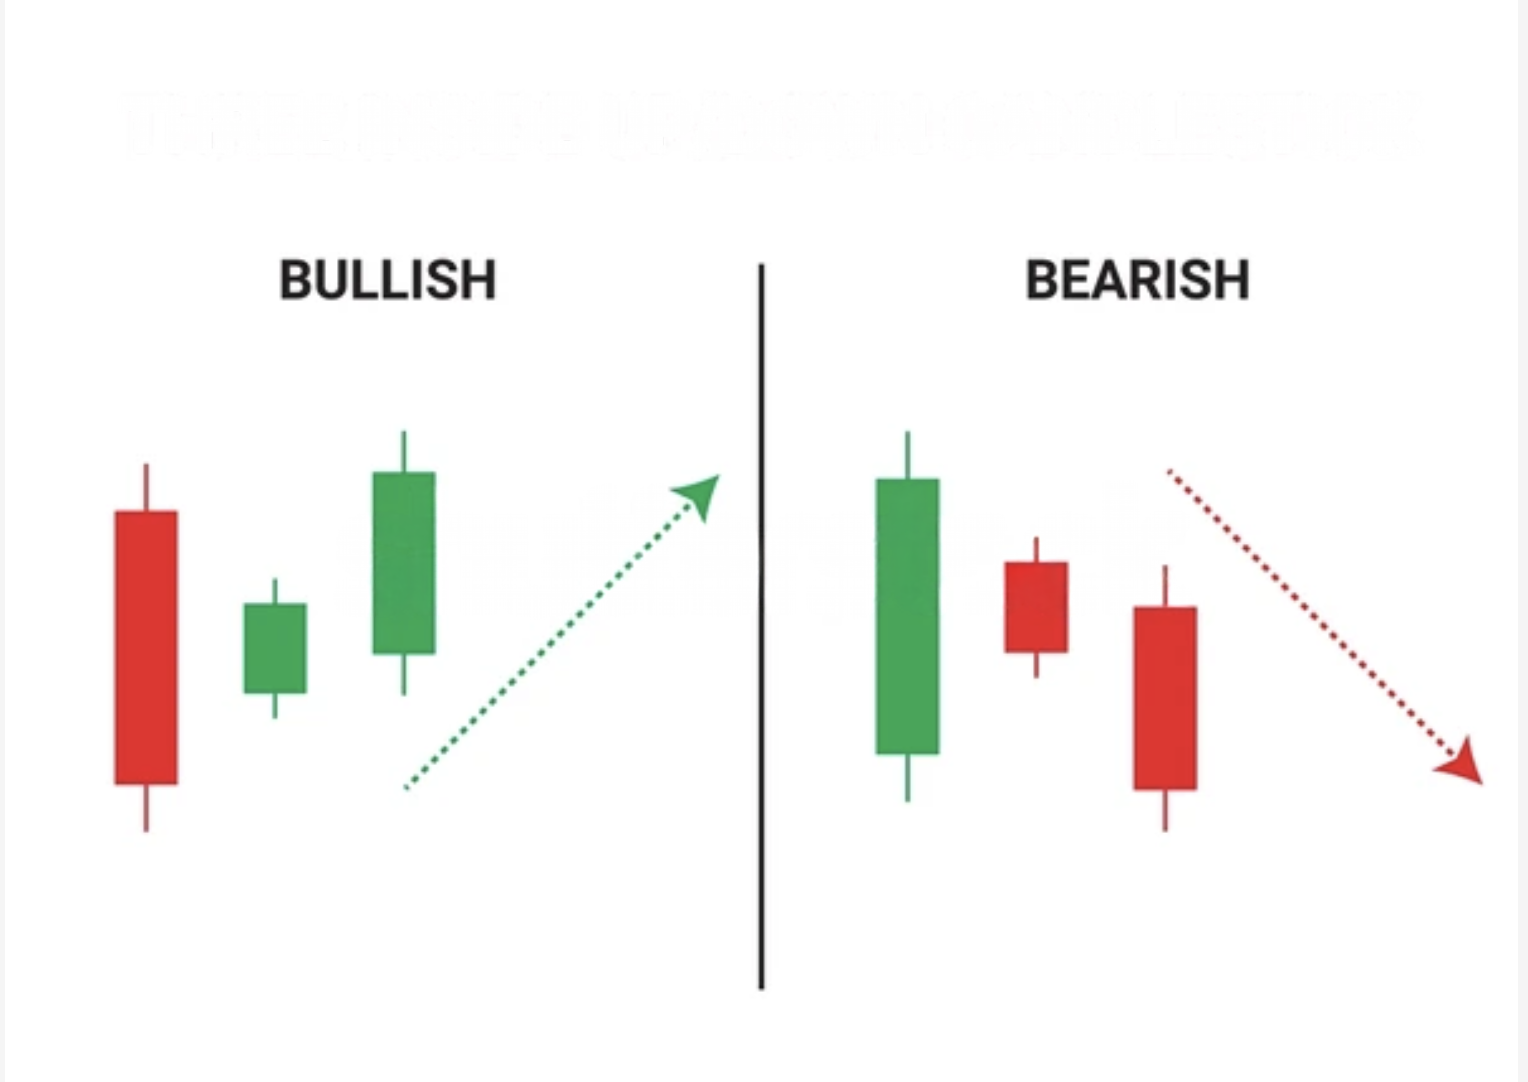
What is the Three Inside Up Candlestick Pattern?
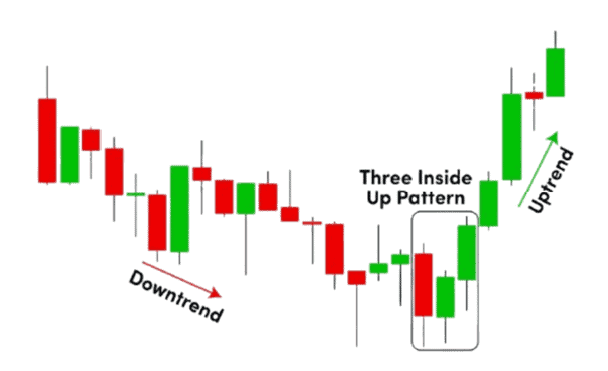
It is a bullish reversal three-candle pattern. It typically forms after a bearish trajectory and implies that selling pressure is subsiding while buyers reclaim dominance. It is considered reliable when it appears after a sustained downtrend and is confirmed by the price action that follows. Overall, this candlestick pattern indicates that the market may have found a bottom, and buyers are pressuring to push prices higher.
How Does Three Inside Up Candlestick Form?
The Three inside up pattern is formed over three trading sessions and is recognized by a specific sequence of candlesticks. The duration depends on the chart’s timeframe.
- First Candle: A dominant red candle, which indicates prolonged selling.
- Second Candle: A modest green candle, entirely enclosed within the first candle’s body. This signals indecision and potential slowing of the downtrend.
- Third Candle: It emerges assertively breaking above the prior opening. It gives confirmation that the market is moving toward the buyers.
When Does Three Inside Up Candlestick Happen?
This candlestick pattern usually forms at the end of a downtrend or at a pullback in a larger bullish market. If the price has been falling steadily, and then the Three Inside Up pattern forms, it can be an indication that the downtrend may be coming to an end.
Traders must not depend solely on this pattern in isolation. It becomes significantly more meaningful when it appears near a known support level, such as a previous swing low, or when the asset appears to be oversold according to indicators like the Relative Strength Index (RSI).
Example of the Three Inside Up Candlestick Pattern
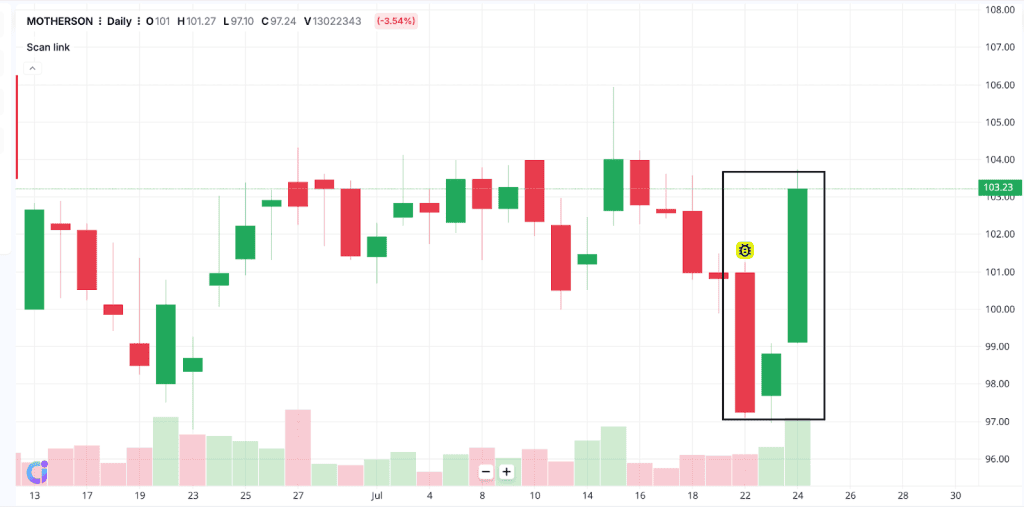
Here’s the daily chart of Motherson Sumi Systems Limited, dated July 24, 2025. You can observe that the stock has been in a bearish phase over the past several sessions. On July 22 formed a strong downward candle. Next, on July 23, it formed a small bullish candle that remained within the body of July 22’s candle. Then on July 24, a strong bullish candle confirmed the reversal in sentiment, completing the Three Inside Up formation.
How Often Does Three Inside Up Candlestick Occur?
This pattern does not appear very frequently. However, when it does appear under the right conditions, such as near support levels or after an extended downtrend, it can be quite reliable. The frequency also depends on the timeframe. For example, it may occur more often on intraday charts compared to weekly charts, but the significance of the pattern generally increases with longer timeframes.
How To Read Three Inside Up Candlestick In Technical Analysis?
To read this pattern effectively in technical analysis, understand the simple structure:
- Make sure it appears after a downtrend.
- Confirm that the second candle remains within the size of the first.
- The next candle must end beyond where the first began.
- Use supporting tools like RSI (to check if the asset is oversold) or volume indicators (higher volume on the third day strengthens the pattern).
How to Trade with the Three Inside Up Candlestick in the Stock Market?
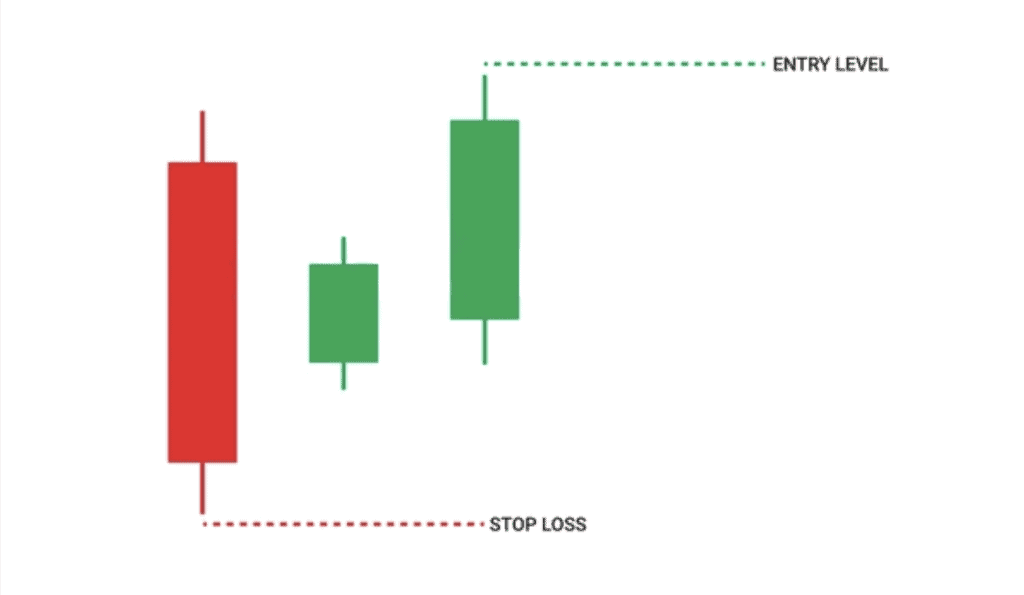
Once the pattern is clearly identified, many traders choose to enter a long position with this practice:
- Buy entry: At the closing price of the third candle or on the next day’s open.
- Stop loss: Position the stop loss near the lowest point of the first.
- Target price: When defining exit points, traders typically reference prior resistance zones or apply a structured risk-to-reward ratio.
In this trade, this strategy means that if you’re risking ₹10 on the trade, you would aim to make ₹20 in profit.
It’s always wise to combine the pattern with broader analysis. For example, if the Three Inside Up forms near a long-term support level or moving average, it holds more weight.
When Is The Best Time To Trade Using Three Inside Up Candlestick?
The most effective time to trade this pattern is when it forms after a clearly defined downtrend and ideally near a key support level. It also helps if the market shows signs of being oversold, as this increases the chances of a reversal.
This pattern tends to perform better in stocks or assets that are generally trending and have periods of healthy corrections. Trading it in sideways or low-volume markets can lead to mixed results because the price movement may lack confirmation.
What Are The Advantages Of Three Inside Up Candlestick Pattern?
This candlestick pattern offers many benefits when used thoughtfully in technical analysis:
- It can be identified easily on a candlestick chart and provides a visually clear signal of a possible trend reversal.
- It helps traders define entry and exit points with logic. The structure of the three candles offers a natural way to set stop-loss and target levels.
- The pattern works well alongside other technical tools.
- It is also versatile across different timeframes. The pattern can be even more effective when supported by a broader market context.
What Are The Disadvantages Of Three Inside Up Candlestick?
However, like all technical patterns, this has some loopholes too:
- It can provide false signals in sideways or low-volume markets. The price may form the pattern but fail to follow through with a strong upward move.
- The pattern offers confirmation only after three candles have formed. By the time a trader enters the trade, part of the price reversal may already have taken place.
- Depending exclusively on this pattern without accounting for other market factors can result in misjudged trades.
It is always advised to use any pattern or indicator with other methods of analysis for improved accuracy.
What is the Opposite of the Three Inside Up Candlestick?
The exact opposite pattern is called the Three Inside Down. Which suggests a potential bearish reversal, appearing after an uptrend. This formation opens with an upward candle, next by a modest downward move entirely within the first, and finally a decisive bearish candle that ends below where the initial upward move began, confirming a change in control.
What Candlestick Pattern is Similar to the Three Inside Up Candlestick?
A similar pattern is the Morning Star, which also represents a bullish reversal. The Morning Star includes a large bearish candle, followed by a candle of small body (often a doji), and then a large bullish candle. While the structure is slightly different, they indicate a similar pattern.
Three Inside Up vs Three Inside Down: What’s the Difference?
The Three Inside Up and Three Inside Down are opposite candlestick patterns. Both indicate a possible reversal in market trend. Here’s the difference between the two:
| Basis | Three Inside Up | Three Inside Down |
| Trend Before Pattern | Downtrend | Uptrend |
| First Candle | Long bearish candle | Long bullish candle |
| Second Candle | Small bullish candle enclosed in the body of the previous candle. | Small bearish candle within the first candle’s body |
| Third Candle | Bullish candle that closes above the previous candle’s open | Bearish candle which closes below the previous candle’s open |
| Indicates | Bullish reversal | Bearish reversal |
| Trading Signal | Entry point for potential long position | Signal to exit or consider shorting |
Candlestick patterns are a visual way to understand market psychology. The Three Inside Up candlestick pattern stands out as a powerful visual indicator of a possible market reversal. While it offers clear entry and exit points, it may provide more accuracy when used with other indicators. It’s a useful tool in a trader’s strategy, but you should never rely only on one single indicator or pattern for your trading strategy.
FAQs
A “triple candlestick” pattern refers to a formation that involves three consecutive candles on a price chart, used in technical analysis to signal potential market reversals or trend continuations. These patterns, like the Three Inside Up or Morning Star, offer more confirmation than single or double candlestick patterns due to their multi-step structure.
The Three Inside Up pattern is considered moderately accurate, especially when used with confirmation tools like volume, support zones, or RSI. While not foolproof, it offers a strong signal of trend reversal when seen after a clear downtrend. Its reliability improves significantly when it appears on higher timeframes like daily or weekly charts.
The Three Inside Up is a bullish reversal pattern. It appears after a downtrend and indicates a possible shift in momentum from sellers to buyers. The pattern suggests that bearish pressure is weakening and buyers are stepping in, making it a potential signal to enter long (buy) positions.
Yes, the Three Inside Up is considered reliable, especially when it forms after a steady downtrend and is supported by indicators like volume increase or oversold RSI. However, like all technical patterns, it works best when used with other confirmation tools. It’s more dependable on longer timeframes than in short-term, volatile markets.
Absolutely. The Three Inside Up is a great pattern for beginners to learn, as it’s easy to spot and teaches the concept of trend reversals. However, new traders should avoid relying solely on this pattern and should always use stop-losses and risk management strategies, along with basic indicators, before trading.
There isn’t one “best” timeframe for using the Three Inside Up pattern. it depends on the trader’s goals and strategy. Some prefer daily charts for their stability and reduced noise, while others explore hourly or 4-hour charts for shorter-term trades. In general, higher timeframes may offer more reliable signals, but opportunities can also appear in lower timeframes with proper confirmation.