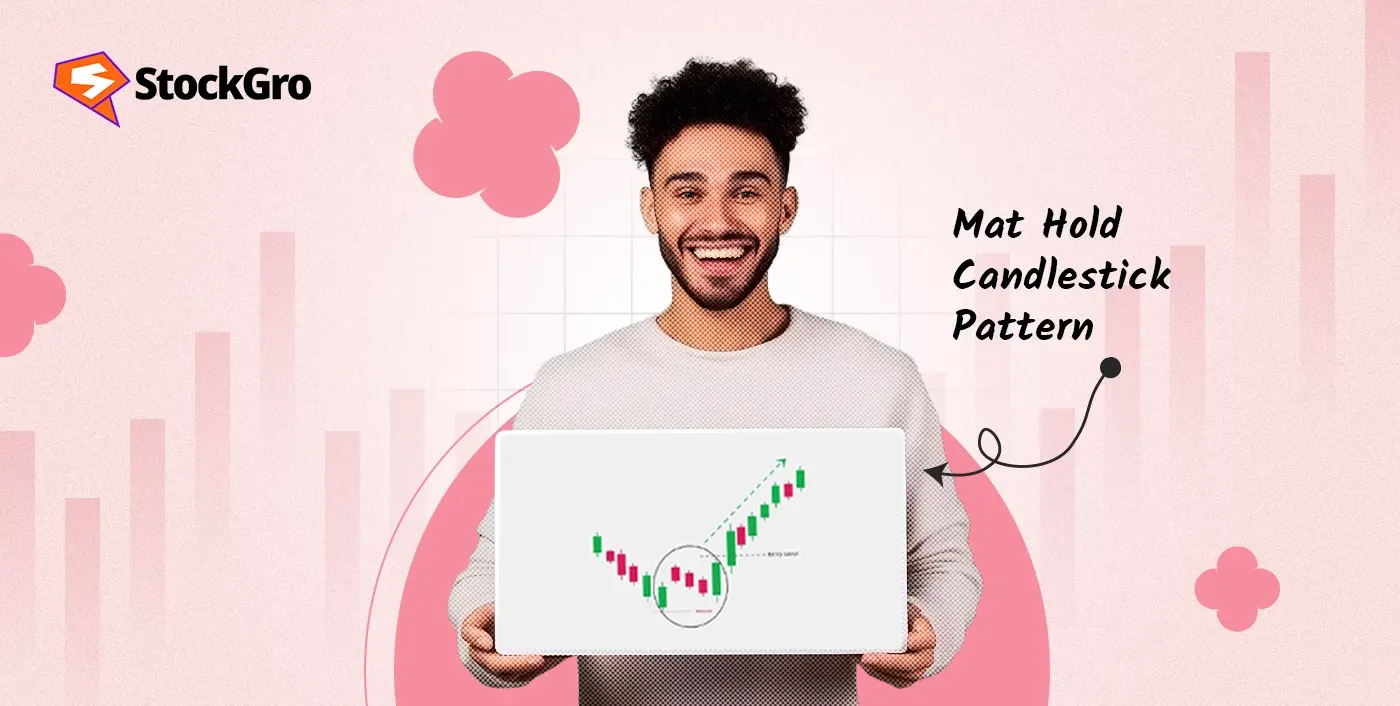
Hesitation to enter a trade during a downtrend, unsure whether the selling pressure has truly ended is a common challenge for many traders. Waiting too long might mean missing the move, while jumping in too early could lead to losses. The three outside up candlestick pattern offers a structured way to identify a possible shift in market direction. In this blog, you’ll learn how this pattern forms, what it indicates, and how it can support better entry decisions.
What is the Three Outside Up Candlestick Pattern?
The three outside up candlestick pattern is a formation that signals a bullish reversal once a downward trend begins to slow. The pattern is made up of three candles, starting with a small red candle, followed by a strong green one that completely covers the first, and ending with another green candle. The setup often reflects a market turning point, where demand begins to overpower supply.
How is the Three Outside Up Formed?
Emerging during a downtrend, this pattern is includes:
- A red candle showing bearish momentum
- A green candle that fully engulfs the first
- Another green candle closing above the second
This setup often points to a transformation in market mood, with selling pressure fading and buying interest taking over.
Example of Three Outside Up

To better understand how the pattern works in real market conditions, let’s take an example.
Suppose XYZ Ltd. has been in a downtrend for the past few sessions, with traders showing selling pressure and the stock gradually declining. On Day 1, the stock opens at ₹480 and closes slightly lower at ₹470, forming a small bearish candle, indicating that sellers are still active but momentum is slowing.
On Day 2, the stock opens even lower at ₹465, but then strong buying interest pushes the price up throughout the day, and it closes at ₹495.The second candle not only reverses the prior drop but also overshadows the entire first candle’s range.
On Day 3, XYZ opens at ₹498 and closes higher again at ₹510, confirming continued buying strength. This three-day pattern signals that bullish sentiment is returning, potentially indicating the end of the downtrend.
When does the Three Outside Up Candlestick happen?
The formation takes place over three consecutive sessions in a declining trend. Day one begins with a small bearish candle, reflecting fading selling interest. On day two, a strong bullish candle appears, completely covering the previous candle’s range, signalling increased buying activity. Day three closes with another bullish candle, reinforcing continued buyer participation. The sequence suggests a possible change in short-term price direction. This pattern is often observed by traders when bearish pressure weakens and buyers start responding more aggressively within the same timeframe.
How to read the Three Outside Up Candlestick in Technical Analysis
A daily shows where price opened, its high and low, and where it closed within the day. A red or black candle shows falling prices, while a white or green one suggests upward movement. The thin extensions above and below the candle body called wicks or tails, reflect the entire price range for that session. These components help analysts observe potential shifts in price behaviour.
To identify a valid three outside up pattern in technical analysis certain conditions must be met:
- It must appear after a sustained downtrend
- Day 2’s candle opens lower than Day 1’s close
- Day 2’s candle closes above Day 1’s open
- Day 3’s close is higher than Day 2’s close
- A larger second candle adds strength to the pattern
Best Timeframes for Three Outside Up
This pattern is suitable for both intraday and short-term swing trading.
- Works best on daily charts with holding periods of 1–10 days.
- 15-minute and 5-minute charts are also popular among intraday traders.
- Widely applicable in markets like equities, forex, and cryptocurrencies due to its focus on price movement.
How often does the Three Outside Up Candlestick occur?
This pattern appears fairly often in the market and is seen as a trustworthy reversal signal. While it may not always result in large gains, historical studies suggest a five percent net profit on average when used with confirmation tools. Its frequent appearance and moderate success rate make it a go-to pattern in many technical trading strategies, especially for those focused on price action.
How to Trade Using the Three Outside Up Candlestick Pattern
To trade using the three outside up candlestick pattern, follow these basic steps:
- Assess the overall market context before considering a position.
- Confirm that the pattern has formed at the end of a downtrend.
- The pattern must show three candles: a small bearish, a strong bullish engulfing it, and another bullish closing higher.
- Some traders watch for a break above the third candle’s high, often placing entries after the next day’s opening.
- Position stop-loss just beneath the low of the second candle.
- Exit strategies vary, some use a 1:2 risk-reward ratio, target percentages, or wait for trend shifts.
What is the Opposite of Three Outside Up Candlestick?
The opposite version of this candlestick setup is the three outside down pattern. It typically appears during an uptrend. The first candle reflects ongoing bullish sentiment, closing higher than it opens. The second candle opens higher but then moves sharply lower, engulfing the previous candle’s range, suggesting a shift in control. The third candle closes lower, reinforcing the downward direction. This sequence may signal that buyers are losing control while sellers are starting to dominate short-term price action.
Advantages of Three Outside Up Candle Pattern
The three outside up candlestick pattern offers several benefits that make it a preferable choice.
- Flexible timeframe: Each candle can represent any time period, from minutes to days, depending on the chart used.
- Clear price details: The pattern shows open, high, low, and close prices, helping to spot possible shifts.
- Easy to read: The pattern is easy to read and interpret, even for those with basic chart knowledge.
- Works with indicators: It pairs well with most technical indicators for added clarity.
- Shows market behaviour: The pattern can reflect changes in buyer and seller activity over a short period.
Disadvantages of Three Outside Up Candle Pattern
Although this pattern can be handy, it also comes with certain limitations:
- Too much detail: Some strategies focus on fewer signals. Candlestick charts can feel cluttered and distracting for such approaches.
- Not always reliable: The pattern may not lead to strong price moves every time. It’s more reliable when used alongside other technical indicators.
- Can be unclear: It’s hard to know what price action came first unless observed live or on lower timeframes.
- Gaps between candles: Prices may open or close with gaps, which can mislead pattern formation.
- Pattern-seeking bias: One common risk is seeing patterns that aren’t really there, which can lead to false confidence.
- Overconfidence: User-friendly charts can give a false sense of certainty and overlook deeper market signals.
Three Outside Up vs Three Inside Up
Both three outside up and the three inside up patterns are used to spot potential bullish reversals after a downtrend. Although they aim to show trend reversals, these patterns differ in candle structure and the way momentum shifts. Here’s how:
| Feature | Three outside up | Three inside up |
| Type | Bullish reversal pattern | Bullish reversal pattern |
| Market trend | Takes shape during a downward market trend. | Takes shape during a downward market trend. |
| First candle | Bearish (larger in size) | Bearish (larger in size) |
| Second candle | Bullish, fully engulfs first candle | Bullish, contained within first candle |
| Third candle | Bullish, closes above second candle | Bullish, closes above second candle |
| Strength | Stronger early signal | Gradual confirmation |
| Visual clarity | Easier to spot | Slightly more subtle |
Conclusion
Not every bounce means a reversal but some patterns hint at one. The three outside up candlestick pattern adds structure to that possibility, offering a glimpse into shifting price behaviour. While it doesn’t predict outcomes, it remains a chart formation worth noting for its clarity and consistency.
FAQ
The three outside up candlestick pattern is bullish. It typically appears after a downtrend and signals a potential reversal to the upside. The pattern consists of three candles: the first is bearish, continuing the downtrend; the second is a larger bullish candle that completely engulfs the first; and the third is another bullish candle that closes higher than the second.
The three outside up pattern consists of three candles: a first bearish candle, a second bullish candle that fully engulfs the first, and a third bullish candle closing above the second. By comparison, the bullish engulfing pattern has only two candles, a bullish candle that engulfs a bearish one. The extra third candle in the three outside up provides stronger confirmation of a potential upward reversal.
Beginners may find the three outside up patterns easy to recognise because of its clear three-candle arrangement. Still, using it successfully in trading usually requires supporting technical analysis and care, as relying solely on the pattern can sometimes result in mistaken signals.
This pattern is more effective in actively traded stocks or markets with clear price trends and high liquidity. It is commonly used in swing trading and across various global market segments, especially when combined with methods like volume analysis and supplemental technical indicators.

