Candlestick charts can feel like a language where every word looks the same. Dojis? Even worse. They all look like ‘+’ signs, but apparently, some are bullish, some bearish, and others mean absolutely nothing. Confusing, right? That’s exactly why this guide exists. In this blog, we will discuss in detail the different types of doji candle patterns, what they look like, what they signal, and how to use them without falling into the overthinking trap.
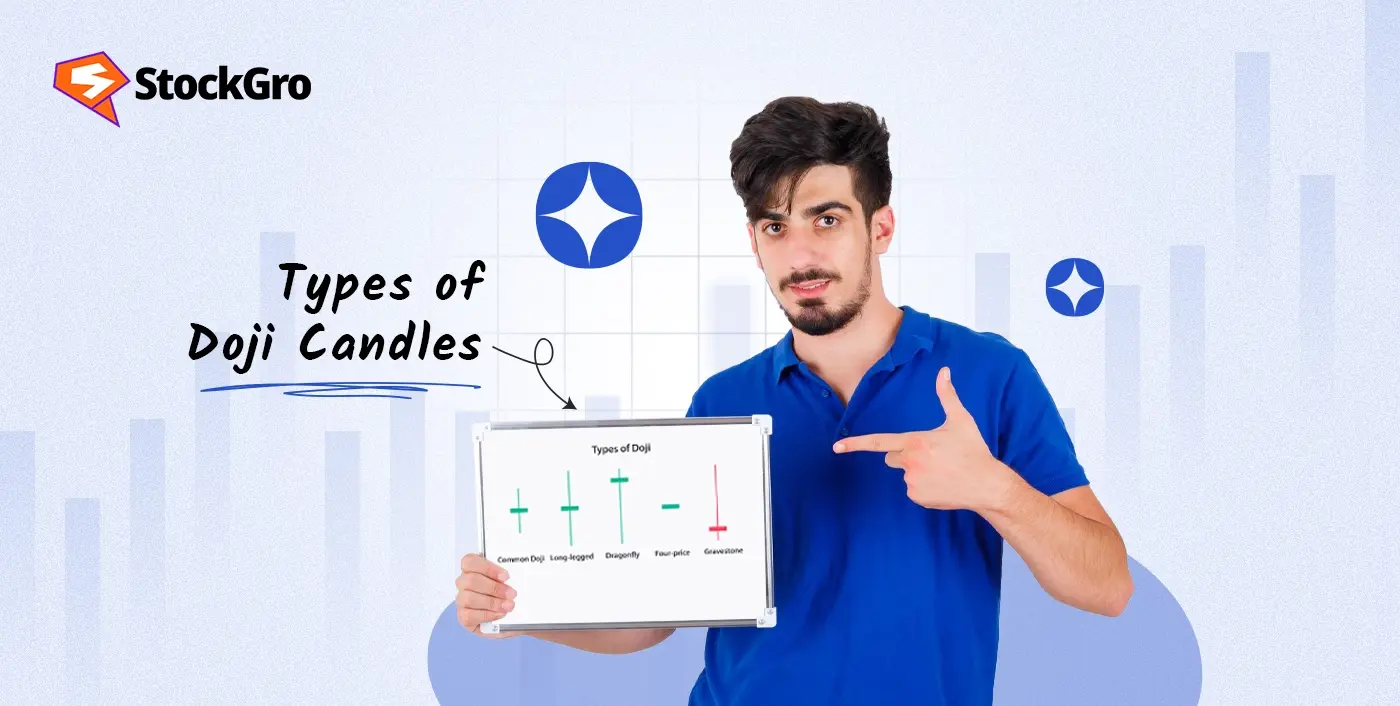
Different Types of Doji Candlestick Patterns
Various types of doji candlestick patterns exist, each offering its unique structure and interpretation. The main types of doji candle are:
- Standard Doji
A standard doji takes shape when the open matches closely with the close. It shows a pause in movement but its meaning depends on the surrounding candles. If it appears after a rally and is followed by a bearish candle below its low, it may be weak. After a decline it might be a recovery.
- Long-Legged Doji
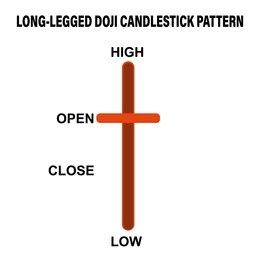
A long legged doji is made up of long wicks on both sides and a small body in the middle, showing strong price movement in both directions. Neither buyers nor sellers gained control. If the close is slightly higher, it may resemble a bullish pin bar especially when seen near support or resistance levels.
- Dragonfly Doji

Dragonfly doji have long lower wicks and no upper shadow. These show that selling was strong initially, but buyers eventually returned the price near its opening point. This type can appear at the bottom of a downward move and, if followed by bullish confirmation, may indicate a change in direction.
- Gravestone Doji

It is the opposite of the dragonfly, with a long upper wick and minimal or no lower wick. Opening, lowest, and closing values all settle near the lower end. Gravestone doji indicates how buyers lifted prices upward but lost control before the session closed. When it appears after an upward move, especially near resistance, it may hint at growing selling pressure.
- Four Price Doji
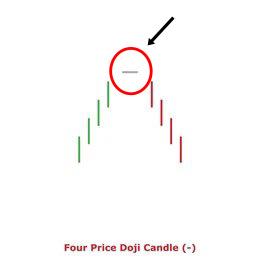
A four price doji appears as a flat line, four values open, close, low, and high match perfectly. It reflects a complete lack of movement during the session. This rare pattern usually forms in low-volume or illiquid markets. While it signals extreme stillness, its significance depends on when and where it appears on the chart.
- Double Doji

A double doji is when two dojis form back to back, a prolonged period of low conviction. It often signals a bigger move is building up. Traders look for a strong breakout candle after the second doji, as that move, up or down, often sets the direction for the near term market action.
How to Trade Using Different Doji Patterns
Here are some ways to trade using doji candles:
- To build a bullish setup, set a buy entry slightly above the doji’s top and place a stop-loss under its bottom.
- For bearish setups, place a sell order just below the doji low with a stop-loss above the high.
- Only enter if the next candle confirms the direction by breaking the setup level.
- Apply a trailing stop to handle exit levels efficiently.
- Consider the pattern’s location near support or resistance for better context.
- Always calculate the risk/reward ratio to evaluate whether the trade setup is worth taking.
Common Mistakes When Using Doji Patterns
Traders often misread doji candles, especially when used without confirmation. These are the frequent errors you should look out for:
- Assuming a doji by itself signals reversal, without confirmation from the following candle.
- Overlooking where the doji forms, such as near major support or resistance zones.
- Not considering volume, which can distinguish between a meaningful pause and a low activity session.
- Not distinguishing between dojis, long-legged or dragonfly dojis behave differently.
- Relying only on doji patterns without pairing them with tools like moving averages or RSI.
- Using dojis alone without combining with additional indicators such as moving averages or RSI.
- Using dojis in sideways markets where the signals are not meaningful or clear.
The multiple types of doji candle patterns may look simple but its presence on the chart often adds meaning to the surrounding price action. Here’s why it’s important:
- It appears in various market conditions, often at key price levels.
- It can indicate a pause after a strong move, helping traders reassess direction.
- It draws attention when seen near resistance or support zones.
- It becomes more meaningful when followed by a strong confirming candle.
- It’s used with other tools like volume or moving averages to make decisions.
- It doesn’t give clear signals on its own but helps filter noise in uncertain price action.
Doji Candles vs Spinning Tops
Both the doji and the spinning top reflect indecision in the market but differ in appearance and meaning. Here’s how they differ:
| Feature | Doji | Spinning top |
| Body size | Extremely small or almost invisible | Small, but clearly visible |
| Open & close | Nearly equal | Slight difference between open and close |
| Shadows | Can vary in length | Equal-length upper and lower shadows |
| Market signal | Stronger sign of indecision | Suggests tug-of-war with slight movement |
| Shape | Thin cross or plus sign | Small body with balanced wicks |
Related Candlestick Patterns
Several candlestick patterns resemble the doji in structure or signal type. The main ones are as follows:
- Hammer: A one-candle pattern featuring a short body on top and a lengthy shadow below, often after a decline. It shows that buyers pushed back strongly after early selling, though confirmation is still needed.
- Hanging Man: Looks like a hammer but appears after an up move. The hanging man pattern shows sellers were active during the session even though the close was near the open.
- Harami: A dual-candle formation in which the second, smaller candle stays fully inside the earlier candle’s range. Harami pattern denotes a pause or narrowing in price action.
What Is A Doji Candlestick Pattern?
A Doji candlestick pattern forms when the opening and closing prices of an asset are almost the same. This creates a candle with a very small or nearly invisible body. It represents indecision in the market, where neither buyers nor sellers have full control.
Doji candles often appear during trend reversals or periods of consolidation. They signal that momentum is slowing and the market may be preparing for a change in direction.
Why Traders Use Doji Patterns
Traders use Doji patterns to identify:
- Potential trend reversals
- Market indecision
- Exhaustion after strong moves
- Entry or exit confirmation points
For example, if a Doji appears after a strong uptrend, it may indicate that buying pressure is weakening. Similarly, a Doji after a sharp fall may signal that selling pressure is fading.
However, Doji patterns work best when combined with volume and other indicators.
Best Indicators To Use With Doji Patterns
Doji candles should not be used alone. Traders often combine them with:
- Support and Resistance Levels – A Doji near strong support can indicate a bounce.
- RSI (Relative Strength Index) – Helps confirm overbought or oversold conditions.
- MACD – Confirms momentum shifts.
- Volume Analysis – High volume Doji signals stronger potential reversal.
- Moving Averages – Identifies broader trend direction.
Using confirmation reduces false signals.
Common Mistakes Traders Make With Doji Patterns
- Trading Doji candles without confirmation.
- Ignoring the overall trend.
- Not considering volume.
- Assuming every Doji means reversal.
- Entering trades without proper risk management.
A Doji indicates indecision — not guaranteed reversal.
Conclusion
Every doji pattern holds potential, but its real value depends on timing and placement. Different type of Doji candles may seem neutral on their own, but near support, resistance, or after strong moves, they can help map out what’s next. Instead of just the candle, combine it with confirmation tools. That’s how doji setups can quietly guide your trading decisions.
FAQs
A doji candle signifies market indecision. It forms when the open and close are almost equal, neither buyers nor sellers are in control. This pattern often appears before a trend reversal, a pause or a big move.
The dragonfly doji and gravestone doji are the most effective, especially after a strong trend. These specific Doji’s can point more clearly to a change in direction given their shape and placement in the trend.
A doji itself is neutral, it’s a balance between buying and selling. Its meaning depends on where it forms in the trend. At the end of a decline it can be bullish reversal, at the end of a rally it can be bearish reversal.
Dojis are somewhat accurate, especially when they form at key levels and are confirmed by other tools or volume changes. Alone they don’t guarantee a reversal or continuation but often show important turning points in the market.
Beginners can use doji candles since they are easy to see and understand. But use Doji with other technical tools or analysis to make it more accurate and reduce false signals.
There are four main types: Standard Doji, Dragonfly Doji, Gravestone Doji, and Long-Legged Doji.
A standard Doji has a very small body with short upper and lower wicks, showing equal buying and selling pressure.
Multiple Doji candles appearing consecutively indicate prolonged indecision and potential breakout in either direction.
A Doji candle looks like a cross or plus sign, with a thin body and upper and/or lower shadows.
The Dragonfly Doji has a long lower wick and little to no upper wick. It often signals a potential bullish reversal.