Some trading days feel calm and predictable, while other days bring sharp moves that test discipline. These shifts are driven by volatility, which determines how intense the price fluctuations are. Learning to measure and interpret the volatility through indicators helps in managing risk and identifying opportunities.
In this guide, let’s understand volatility indicators and their implementation in trading.
What Are Volatility Indicators?
Volatility indicators are tools used to measure how much and how quickly the price changes in a specific stock or market. They allow traders to assess the market risk, identify trends, and time their positions.
When the prices swing sharply in short periods of time, the volatility is said to be high. When there is no or minimal price fluctuation, the volatility is considered low. By understanding the volatility level, we can judge the market trend, manage exposure, and adjust our strategy to follow the current movement.
Why Use Volatility Indicators in Trading?
The key reasons volatility indicators are such a vital tool in trading are listed below:
- Identifying Trends and Reversals: The indicators help in gauging the current trend. Strong signals hint towards the continuation of a trend, while fading volatility increases the possibility of a reversal.
- Risk Management: The market uncertainty is put into numbers by these indicators. This helps in managing the bid sizes and placing stop losses.
- Spotting Breakouts: A breakout needs high volatility to sustain. Periods of low volatility often precede a breakout, and the volatility indicators help in preparing for them.
- Strategy Adjustment: The trading strategy can be altered depending on whether the market is range-bound with low volatility or going through sharp fluctuations.
Types of Volatility in Markets
Volatility appears in different forms depending on how it’s measured and interpreted:
Historical Volatility
The historical volatility looks back at past price movements to calculate how much the prices have fluctuated over a given period. It shows how volatile the market has been, which is useful for assessing the historical risk levels and understanding the price behaviour.
Implied Volatility
The market expectations of how the future prices will move is used to find the implied volatility. It is forward-looking in nature and measured with option contract prices. The India VIX is a good example of implied volatility calculated for the Nifty 50.
Top 6 Volatility Indicators
Here are the most widely used volatility indicators that every trader should understand:
Bollinger Bands
Bollinger Bands measure the deviation of prices from their average to find the volatility. John Bollinger developed them in the 1980s.
There are three components to them:
Middle Band = Simple Moving Average (usually 20 periods)
Upper Band = Middle Band + (2 x Standard Deviation)
Lower Band = Middle Band – (2 x Standard Deviation)
The following chart shows Bollinger Bands on the Nifty 50 during February 2026:
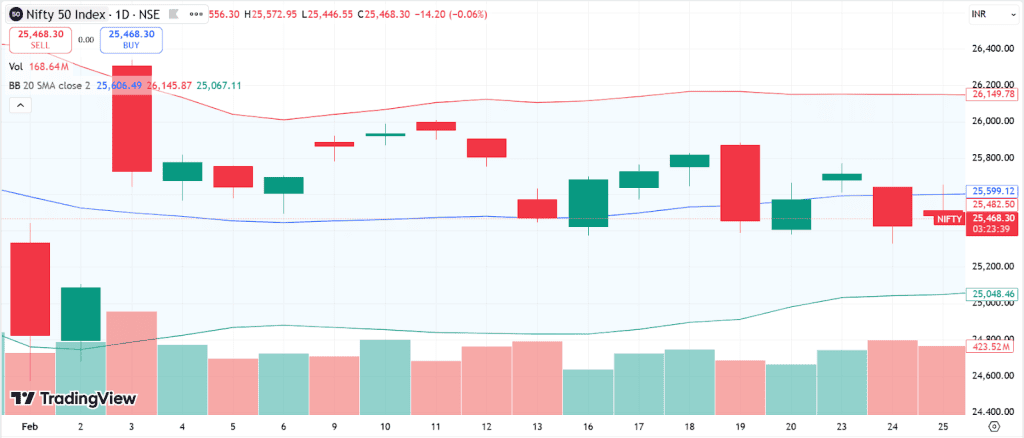
The blue line at the centre is the middle band, which currently stands at 25,599. The red line at 26,149 and the green line at 25,048 are the upper and lower bands, which make up the range.
Average True Range (ATR)
The ATR calculates the difference between highs and lows of a price over a set period. It only shows the intensity of price movement, not its direction. J. Welles Wilder Jr. introduced ATR.
The formula for ATR is:
ATR = [Previous ATR x (n-1) + Current TR] / n
where n is the number of periods, and Current TR is the True Range that represents the volatility of the current period.
TCS’s price movement and ATR from February 10 to 25, 2026, are given below:
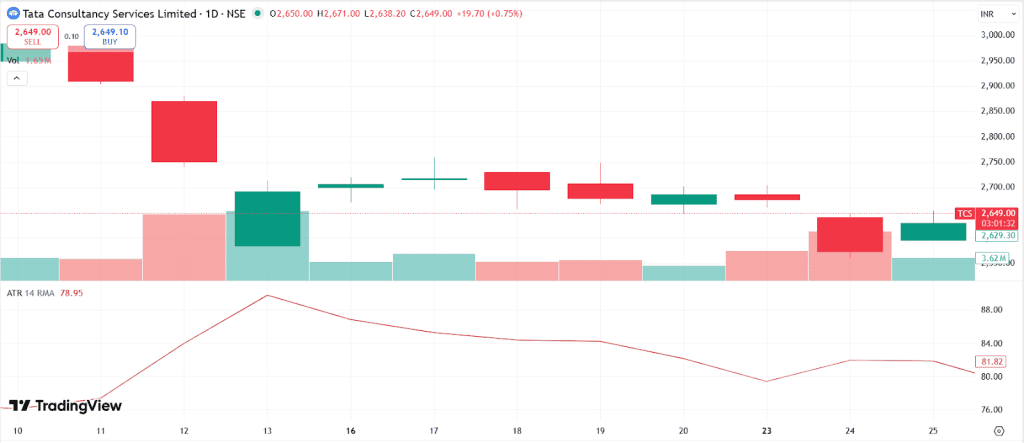
The ATR peaked on February 13, 2026, at around 89, but it has since dropped to 81.82, indicating that the volatility is getting lower in the shares of TCS.
Volatility Index (VIX)
The Chicago Board Options Exchange (CBOE) created the Volatility Index. It measures volatility based on the option prices for the next 30 days. The VIX is also called the “fear index” or the “fear gauge”. It reflects the market sentiment and anticipation of future price movement rather than the actual price direction.
The India VIX for January 2026 is presented below:
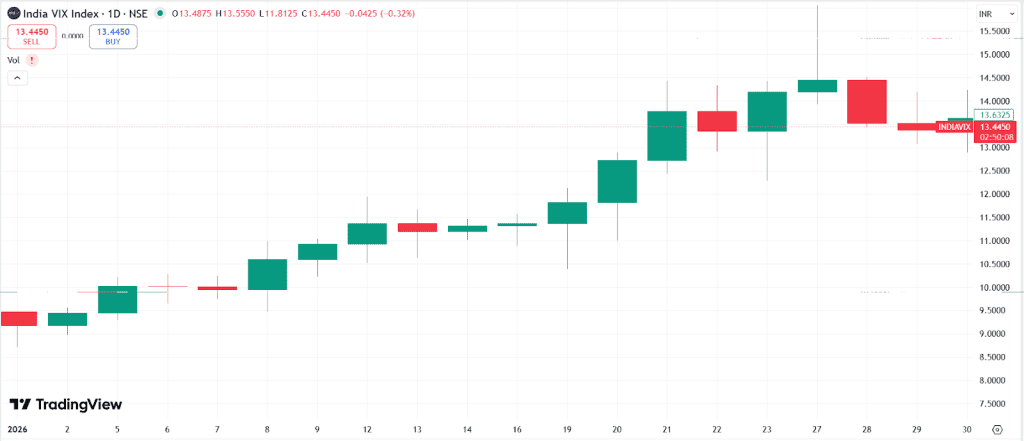
The chart shows growing volatility and higher risk levels as the VIX score moved from 9.3 at the start of the month to over 13.5 at the month’s end.
Keltner Channels
Keltner Channels were introduced by Chester W. Keltner in 1960. It was later modernised with the ATR in the 1980s. Keltner channels are used to identify trends and breakouts.
The Keltner Channel is made up of the following components:
Middle Line = 20-period Exponential Moving Average (EMA) of the closing price
Upper Channel Line = Middle Line + (2 x ATR)
Lower Channel Line = Middle Line – (2 x ATR)
A look into Adani Green’s movement during February 2026, along with Keltner Channels, provides information on its volatility.
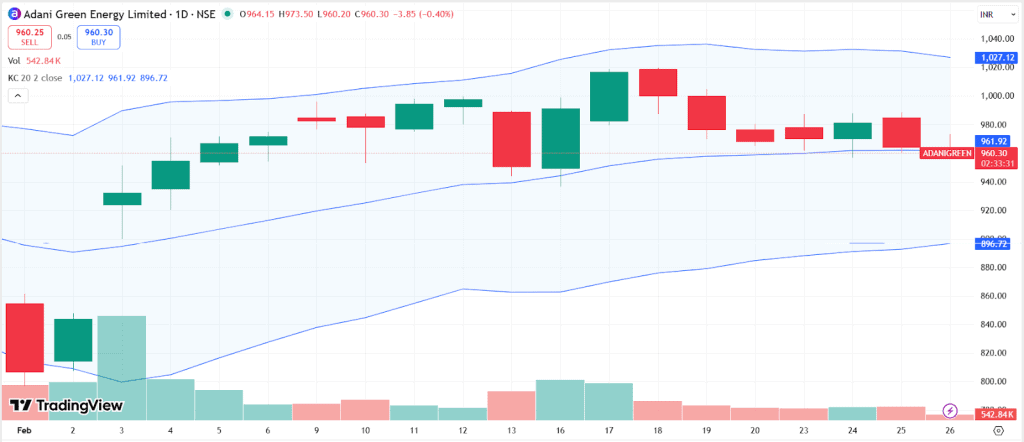
Currently, the price is at 960.30. The channel has a wide gap at the start of the month, but that gap has shrunk by the end. It indicates the volatility is reducing and the price is moving sideways.
Donchian Channels
Richard Donchian, a pioneer of trend following systems, created the Donchian channels. It measures the price range by plotting the highest highs and lowest lows to determine the volatility, making it very efficient for breakouts.
The Donchian channels are plotted with three lines:
Upper Channel = The highest high in a given n period
Lower Channel = The lowest low over the given n period
Middle Channel = (Upper Channel + Lower Channel) / 2
The following chart shows Donchian channels on Ultratech’s chart in the past month, from January 27, 2026, to February 26, 2026.
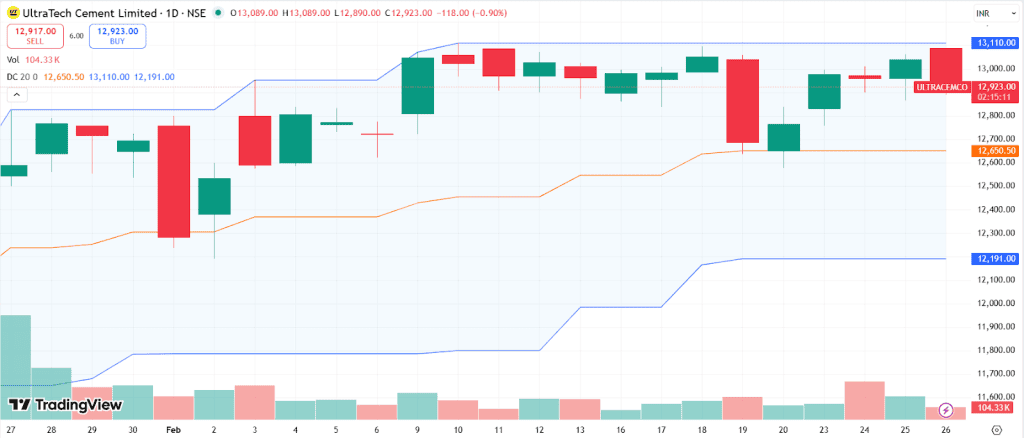
Although the price has moved from ₹12,200 to around ₹12,900, the channels have maintained almost equal gaps, meaning the volatility has stayed consistent over the last month.
Chaikin Volatility
The Chaikin volatility calculates how fast the price range is changing. It focuses on how quickly volatility is expanding or contracting, making it useful for spotting potential reversals. Marc Chaikin is the man behind Chaikin volatility.
State Bank of India’s chart from February 11 to 26, 2026, is given below:
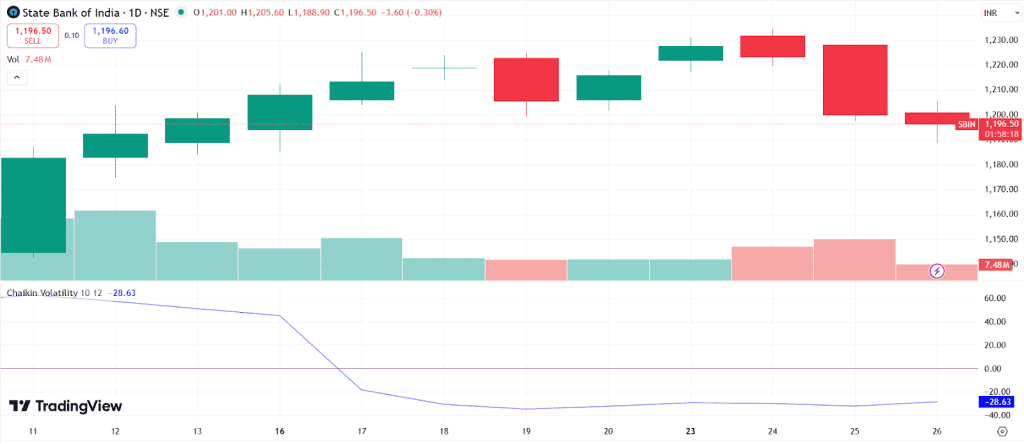
The Chaikin score has dropped from over 60 to -28 in the last 15 days, showing the momentum is getting weaker, and the stock price is getting flatter.
How to Read & Interpret Volatility Indicators
Reading volatility indicators requires context:
- Bollinger Bands: Widening Bollinger Bands indicate stronger price swings and greater activity, usually present in breakouts or fast trends. Narrow bands mean the volatility is reduced, and the market is building pressure before taking a direction.
- ATR: Rising ATR value reflects high price changes and stronger movement intensity. Lower ATR shows calmer trading sessions, associated with sideways markets.
- VIX: A subdued VIX means less volatility and stable conditions. Elevated VIX means the market is growing uncertain, and the overall risk is increasing.
- Keltner Channels: When the channel is getting wider, it means strong momentum and an expanding price range. On the flip side, a compressed channel suggests softer price action and consolidation.
- Donchian Channels: High volatility is marked by large gaps between the upper and lower bands. Narrow bands reflect restricted movement and lower volatility.
- Chaikin Volatility: If the Chaikin reading is high, it shows active participation and more fluctuations. A weaker reading means the market is moving horizontally.
How to Use Volatility Indicators in Trading Strategies
Volatility indicators can support a variety of strategies:
1. Breakout Trading
Trading a breakout involves identifying periods of low volatility that are followed by strong price expansion. When volatility contracts, it often means the prices are getting ready to breakout. The focus here is to wait for confirmation with rising volatility and then take a trade position.
For example, if a stock is moving between ₹1,000 and ₹1,020 for several days and the Donchian channel becomes narrow, a breakout above ₹1,025 with expanding bands may serve as an entry signal.
2. Trend Confirmation
Volatility indicators help confirm whether a price trend has strength. When the bands and channels are expanding, and the ATR is rising, it reflects strong participation. However, if the bands stay tight or the ATR has minimal change, it means the trend lacks conviction. Trading in a strong trend reduces the chance of false signals and losses.
For example, assume shares of a company climb from ₹600 to ₹630, and ATR increases from ₹4 to ₹10. It indicates the trend is strong. If the widening bands support this move, it means a long position can be considered.
3. Risk Management
Volatility indicators provide protection against market uncertainty. When the volatility is high, traders reduce their bid sizes and widen the stop-loss to leave room for flexibility. Tighter stops are sufficient in low volatility periods. Many also use ATR for a trailing stop-loss that adjusts to keep the risk level the same in all market conditions.
As an example, suppose ATR is ₹5, and the trader has placed a stop ₹10 away from entry. If the ATR rises to ₹15, placing only a ₹10 stop may frequently trigger exits. In this situation, moving the stop-loss to ₹25 helps in maintaining a balanced risk level.
4. Entry & Exit Timing
The indicators also help in refining the entry and exit timing. The goal is to enter when the volatility is expanding and exit when volatility becomes excessive or starts contracting. Monitoring the bands, channels, and ATR also helps in determining whether to hold a trade or not.
For example, if a stock jumps from ₹875 to ₹900 and Bollinger Bands expand rapidly, it is beneficial to stay in the trade. However, if price spikes to ₹960 and ATR jumps sharply, it may indicate overextension, signalling profit booking or tighter stop loss placement.
Conclusion: Choosing the Right Volatility Indicators
Choosing the right volatility indicator depends on your trading style and goals. Indicators like Keltner Channels and Bollinger Bands are used in trending markets and breakouts, while other indicators, like the VIX, are better suited for gauging overall market sentiment rather than individual trades. The ATR helps in sizing positions and managing the risk.
By combining various volatility indicators and aligning them with the price action, traders can build robust strategies that adapt to changing market conditions.