It looked perfect. A bullish candle punching through resistance. You bought, thinking you caught the move early. But the volume bar? Barely moved. Ten minutes later, price pulled back, leaving you holding the peak. This is what happens when you ignore volume. A volume breakout can help confirm real participation behind price moves. In this blog, we explain what it means, why it is important, its best strategies and more.
What is a Volume Breakout?
A volume breakout happens when price crosses a support or resistance level with more volume. This increase in activity shows more traders are involved in the move which may add weight to the breakout. It’s used to check if the price move has enough backing.
Why Volume is Important in Breakout Trading
In breakout trading strategy, volume acts as a filter to judge the strength behind a price move. A breakout supported by high volume often reflects broader market involvement, while a low-volume breakout may lack support and reverse quickly. This makes volume useful for separating moves backed by participation from those driven by noise. Without volume confirmation, even a clean price breakout can be misleading and less dependable, making volume an important part of analysing breakout setups.
How to Identify a Volume Breakout
The steps to identify a volume breakout are as follows:
- Begin by spotting a period where price stays within a range or consolidates with low or stable volume levels.
- Watch for a price bar that closes strongly above resistance or below support.
- Along with this move, look for a clear increase in volume ideally, the volume bar should be higher than the recent average bars.
- Breakouts backed by a high volume on the same candle are often treated as stronger.
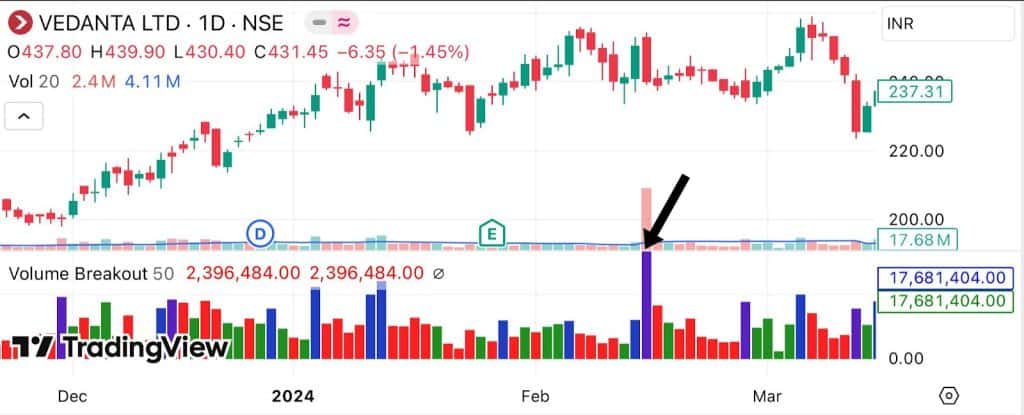
In the Vedanta Ltd chart below, the arrow points to a strong volume breakout where price moves out of a narrow range. The purple volume bar is significantly taller than previous bars, reflecting a clear spike in activity that supports the breakout seen on the same day.
Best Indicators for Volume Breakout Trading
The indicators that be used to measure volume strength and help validate breakouts more effectively are as follows:
- Moving Average with Volume
This indicator applies a moving average to volume bars to identify unusual spikes. If the breakout volume bar rises well above the moving average, it signals stronger-than-normal activity, which can be used to confirm that the price move is supported by increased market participation.
- Volume Oscillator
Volume oscillator calculates the difference between a fast and slow volume moving average to detect changes in volume pressure. A reading above zero during a breakout shows that recent volume is stronger than the longer-term average. This added strength can help distinguish stronger price moves from less supported ones.
- On-Balance Volume (OBV)
OBV adds volume on up closes and subtracts it on down closes to track buying or selling pressure. A rising OBV line during a breakout indicates accumulation and adds confidence to the price move. It’s especially useful when OBV breaks out before the price, acting as a lead signal.
Volume Breakout Trading Strategies
Here are the strategies commonly used in technical analysis to trade volume breakout across different timeframes:
- Price and Volume Breakout Strategy
This method focuses on stocks moving within a defined price range over a period of time. A breakout becomes more meaningful when price closes outside the range and is on much higher volume than recent average. For example if a stock closes above a long standing resistance level with a sudden surge in volume it may indicate a strong move with participation.
- Volume Breakout with Support and Resistance
It focuses on stocks moving within a defined price range over a period of time. A breakout becomes more meaningful when price closes outside the range and is on volume 1.5 to 2 times higher than recent average. For example if a stock closes above a long standing resistance level with a sudden surge in volume it may indicate a strong move with participation.
- Using Volume Breakouts for Intraday Trading
This method uses the high and low formed during the first 30 to 60 minutes of trade as key reference points. A breakout beyond this range with volume 3 to 5 times higher than previous candles may suggest more participation. It’s often used in highly traded stocks where early moves reflect institutional activity and help shape the rest of the session.
Advantages of Volume Breakout Trading
The benefits of using volume breakout trading is as follows:
- It helps confirm if the breakout is supported by strong trading activity, reducing the chance of reacting to weaker moves.
- A noticeable volume increase can suggest stronger participation, sometimes linked to large investors or funds.
- Instruments showing volume-backed breakouts are often preferred for their sharper price swings.
- Clearer confirmation through volume can help with better timed entries and exits.
- This works across multiple timeframes, daily to intraday charts, so it’s flexible for different trading styles.
- Volume confirmation reduces reliance on price alone, adds another layer of analysis.
- It helps filter out moves that may lack conviction, potentially improving decision-making accuracy.
Limitations and Risks of Volume Breakouts
Keep in mind the following limitations when trading with volume breakout strategy:
- A large spike in volume doesn’t always support the breakout; it could signal a sharp end to the price move.
- Sometimes, a breakout candle with high volume quickly reverses, trapping participants who entered late.
- Since volume happens after price starts to move, it may delay the response time.
- One large trade can cause a volume spike, which doesn’t always reflect widespread interest.
- What counts as “high” volume can change from one stock or chart setup to another, making comparison less reliable.
Common Mistakes Traders Make with Volume Breakouts
These are typical mistakes made during volume breakout analysis:
- Acting too early on a price move without confirming the volume increase, or relying on volume alone without price confirmation.
- Entering the trade before the breakout bar fully forms, which can result in chasing failed moves.
- Not looking at the bigger picture, market behaviour which can affect the breakout.
- Placing stop-loss too close, so they get triggered by normal fluctuations.
- Confusing a high volume climax (often a reversal point) with a true breakout.
Tips for Successful Volume Breakout Trading
Some practices that may improve volume breakout analysis are as follows:
- Waiting for full confirmation from both price and volume before acting is often more effective.
- Combine volume breakout setups with simple technical tools like support zones or channel lines.
- A volume surge after a quiet phase is usually more meaningful than one during choppy moves.
- Planning trade levels ahead including entries, exits, and risk limits improves discipline.
- Checking longer-term price charts gives more background on whether the move aligns with past behavior.
Conclusion
Not every breakout is a volume breakout and that’s the difference. Without volume a move may lack power. But with volume and technicals together you get breakouts with real backing. Whether you’re looking for short bursts or longer plays using volume breakout techniques helps you make more informed data driven trading decisions.
FAQs
Some of the best indicators for volume breakouts are volume bars and volume weighted average price (VWAP). Also, tools such as on-balance volume (OBV) and the volume oscillator help spot big changes that happen when breakouts start.
A volume breakout is reliable when price is strongly supported by a big jump in volume. More traders are getting in. But fake breakouts can happen so look for confirmation before you get in.
A true volume breakout is confirmed when price closes above resistance or below support with much higher than normal volume. Extra confirmation from other tools like moving averages, trendlines or momentum indicators can help make sure it’s real.
Yes, volume breakouts are used in intraday trading. When price breaks a level with a big surge in volume it often gives you fast trading opportunities during the day. But still look for confirmation to reduce the risk of false signals.