If you have ever tried reading stock charts, you know it’s not just about looking at prices going up and down. Volume, the number of shares traded, also plays a huge role in understanding what’s really happening.
The Volume Oscillator Indicator (VO) is one such tool that traders use to see if there’s real strength behind a price move. Sounds technical? Don’t worry; we will explain everything in the simplest way we can.
What is the Volume Oscillator Indicator?
The Volume Oscillator looks at two moving averages of volume, one for the short term and one for the long term.
Why? Because traders want to know if trading is getting busier or slower.
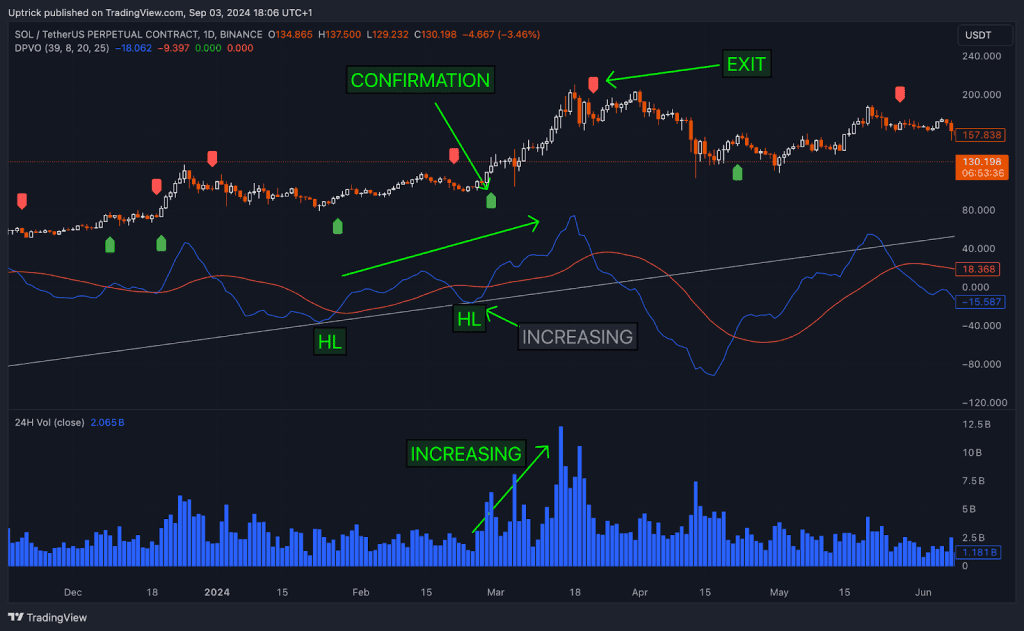
- If the short-term average is higher than the long-term average, it means volume is increasing in the short run.
- If it’s lower, then trading activity is fading.
Think of it as checking the “heartbeat” of the market; it tells you if the current move has energy or is just running out of steam.
How Does the Volume Oscillator Work?
The VO operates by determining the difference between the short-term and long-term volume moving averages. The difference is shown as a percentage.
Here’s the idea:
- Positive VO → Short-term volume is higher → Traders are active right now.
- Negative VO → Short-term volume is lower → Market activity is cooling off.
It’s not about predicting prices directly. Instead, VO helps confirm whether a trend is supported by actual participation from traders.
Volume Oscillator Formula
The formula looks like this:
VO=Short term Volume MA − Long term Volume MALong term Volume MA 100
- Short-term Volume MA: This is the moving average of volume over a short amount of time, like 5 days.
- Long-term Volume MA: This is the moving average of volume over a more extended amount of time, like 20 days.
Don’t stress over the maths; most charting platforms calculate VO automatically.
How to Use the Volume Oscillator in Technical Analysis
VO is rarely used alone. In technical analysis, traders use it with price movement, support and resistance levels, or trend indicators to make better decisions.
Some ways it is used:
- Spot trend strength: Is there a lot of volume behind the uptrend?
- Detecting weak breakouts: Price jumps but VO stays negative? Might be a trap.
- Find possible reversals: Falling prices with rising VO could signal a bounce.
Best Volume Oscillator Settings
Most popular charting software uses 14 days for the fast (short-term) volume moving average and 28 days for the slow (long-term) moving average by default. This 14/28-day combo strikes a compromise between being responsive and stable. It lets the indicator pick up on essential changes in trading activity without being too sensitive to little changes.
A lot of traders do well with these settings, but you can change them to fit your trading style or the current state of the market. Some oscillators are more responsive than others, but they also pick up noise more often. On the other hand, lengthier durations slow down movement, but they can’t react quickly enough to significant changes in the market.
What are the Types of Volume Oscillators
Different volume-based oscillators help traders read market momentum and pressure:
- Chaikin Money Flow (CMF): Price and volume are added together to show how much push there is to buy or sell.
- VWAP (Volume Weighted Average Price): An intraday benchmark that shows the average price transacted, taking into account volume.
- On-Balance Volume (OBV): Keeps track of cumulative volume flow based on the direction of pricing.
- Klinger Oscillator: EMAs of volume are used to find changes in velocity and possible turns.
- Accumulation/Distribution Line (ADL): Shows how much money is coming in or going out of an asset based on its price and volume.
Volume Oscillator vs. Other Volume Indicators
| Indicator | What It Measures | How It Works | Best Use |
| Volume Oscillator (VO) | Momentum of volume changes | Compares short-term and long-term volume moving averages, expressed as a percentage | Checking to see if price patterns are backed up by more or less trading activity |
| On-Balance Volume (OBV) | Cumulative volume flow | Volume is increased on up days and decreased on down ones. | Finding price-volume-flow discrepancies |
| Accumulation/Distribution Line (ADL) | Money flow into/out of an asset | Uses volume and closing price position within daily range | Tracking buying and selling pressure to confirm breakouts or breakdowns |
| Chaikin Money Flow (CMF) | Buying or selling pressure over a period | Based on ADL; averages money flow over a set period | Identifying periods of sustained buying or selling |
| Klinger Oscillator | Trend strength and momentum shifts | Compares two EMAs of volume data | Detecting potential reversals and changes in market momentum |
Volume Oscillator Trading Strategies
The Volume Oscillator works in a variety of market scenarios, and its signals are more dependable when used with other tools. Here are three popular approaches:
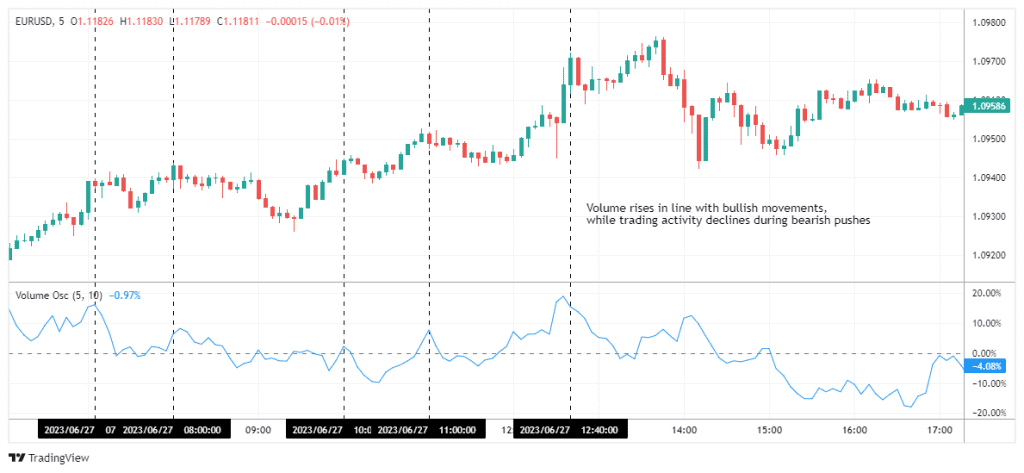
Trend Confirmation with Volume Oscillator
When the price and the Volume Oscillator go in the same direction, it suggests that a lot of people are buying and selling, which supports the trend. This is the pattern that traders typically follow when they buy and sell. Combine VO with technologies like Moving Averages or Parabolic SAR to acquire more reliable signals.
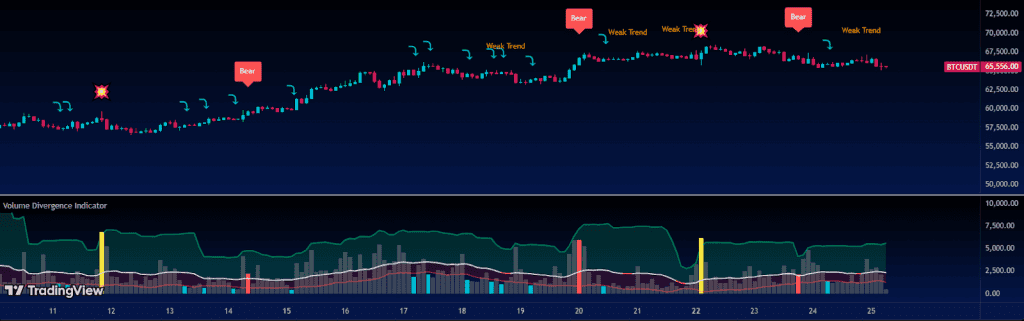
Divergence Trading with Volume Oscillator
Divergence develops when the price moves in one direction but the VO goes the other way. This usually means that the momentum is slowing down and that something might happen shortly. Use oscillators like RSI or Stochastic to verify that this is accurate before you trade.
Combining Volume Oscillator with Moving Averages
You could get stronger trade signals by using the Volume Oscillator and price moving averages together. For instance, when the VO gets above zero and a faster moving average (like the 10-day MA) moves above a slower moving average (like the 50-day MA), this could mean it’s time to purchase.
This twofold confirmation shows that there is a strong trend that is backed up by more volume. Conversely, when both cross downward, it signals selling pressure with volume backing. This combination helps filter false moves and improves the chances of entering sustainable trends.
Advantages of the Volume Oscillator
- Easy to understand: Just two volume moving averages, making it simple for beginners and useful for quick analysis in intraday trading.
- Quick visual check: Positive or negative instantly tells the story without complex calculations.
- Works with other indicators: Can be combined with trend or momentum tools for stronger analysis, especially in intraday trading setups.
Limitations of the Volume Oscillator
- Doesn’t predict price direction directly.
- It can give false signals in low-volume stocks.
- Needs confirmation from other tools like RSI or MACD.
Common mistakes while using the Volume Oscillator for Trading
- Relying only on VO: Always combine with price action.
- Ignoring market context: A festival holiday week or budget announcement can affect volume readings.
- Overtrading small spikes: Not every rise in VO means a significant trend is coming.
Conclusion
The Volume Oscillator Indicator is like a pulse check for the market. It doesn’t tell you where the price will go, but it shows whether traders are backing the move. This is an excellent method to learn how price and volume work together.
Use it as a confirming tool, not as a signal. Try different settings and mix them with your preferred indicators. Over time, you will discover how VO helps you tell the difference between strong and weak moves.
FAQs
Although it has its flaws, the Volume Oscillator might help you notice shifts in the market’s trading activity. It works best when combined with price analysis and other indicators. Relying only on VO can lead to false signals, especially in low-volume stocks.
The VO only looks at two moving averages of volume, unlike On-Balance Volume or Chaikin Money Flow. It focuses purely on volume momentum rather than combining price and volume. This makes it easier to read but less detailed than some alternatives.
VO might be useful for confirming patterns or finding differences. It works best when there are a lot of trades happening in active markets. Its signals can be wrong in markets with limited liquidity or those that are going sideways, thus it’s best to use it with other tools.
To monitor the market’s volatility, many day traders use VO. It helps you find breakouts or trends that are vanishing soon. But it’s not safe to use it alone for quick trades, thus it is used with price movement or other indications.
By keeping track of the average price or number over time, moving averages make trends stand out more. The VO, however, compares two volume moving averages to see if short-term activity is rising or falling. It’s about momentum changes, not just the overall direction.