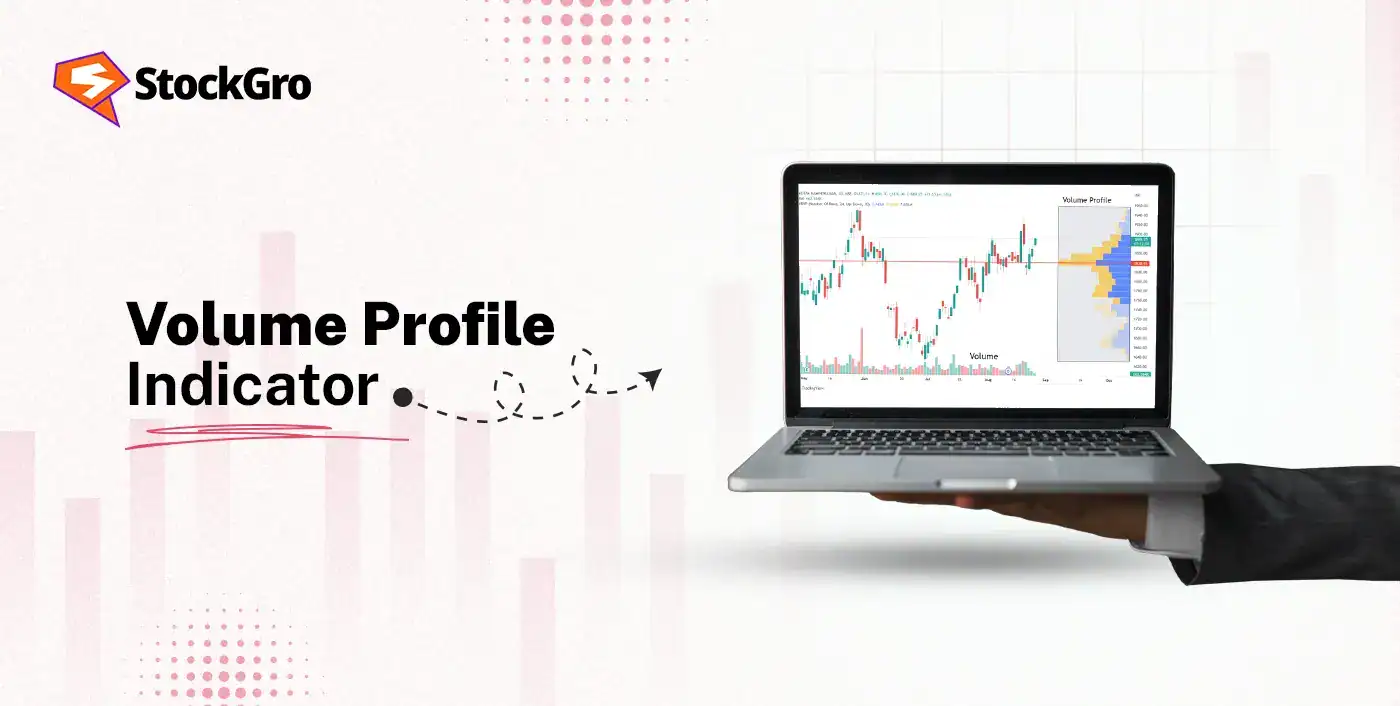
Price movement becomes far easier to understand when it is looked beyond the candles and focused on where the volume actually traded. The Volume Profile indicator does exactly that. It is an indicator that plots traded volume at different price levels.
The volume profile indicator shows how the market distributed its activity, and not just how far the price moved. This helps the traders in interpreting the market structure with more clarity, especially during the intraday volatility.
Read this blog to know more about the Volume Profile indicator, how it works, its types, and how it is used in trading.
What is the Volume Profile indicator?
The volume profile indicator is a trading indicator, which shows the amount of volume traded at each price level on a price chart of a stock, represented in horizontal histogram. The indicator helps traders identify areas of high and low trading activity, which may be further used to find support and resistance levels, understand market sentiment, and spot areas of high interest, such as the Point of Control (POC) or High-Volume Nodes (HVNs).
Unlike traditional volume indicators, which show only total volume over time, volume profile plots volume along the price axis, providing a detailed view of where trading interest is occurring.
How Volume Profile indicator works
- Horizontal volume: The volume profile places a horizontal histogram next to each price level, with the bar’s length representing the volume traded at that specific price.
- Visualisation of trading activity: The traders use the histogram to understand which price levels have high trading activity, longer bars, and which have low activity, shorter bars.
- Identifying high interest area: The volume profile helps in identifying the high interest areas, such as Point of Control (POC), price level with the highest volume, High Volume Nodes (HVNs), the price level at which a high amount of trading has taken place, and Low Volume Nodes (LVNs), the price levels with very little trading activity.
- Value Area: The value area is a range, around 70%, of the total trading volume for a period. The upper and lower boundaries of the value area are the Value Area High (VAH) and the Value Area Low (VAL), respectively.
Types: Session, Fixed Range, Visible Range (when to use)
| Types of volume profile | What is it? | When to use? |
| Session volume profile | It displays volume traded at each price level for a particular session. | It can be used for day trading or analyzing a session to identify price levels with the most activity and to compare volume across different sessions. |
| Fixed range volume profile | It analyses volume over a period of price action that is manually selected by defining a start and end point. | It might be used to analyse a specific, user-defined range, such as, to see how volume was distributed within a breakout or setup. |
| Visible range volume profile | It automatically adjusts to show the volume profile for whatever is currently visible on the screen. | It is used for a quick, on-the-fly analysis of a chart’s current visible area, to quickly get a big picture view of volume distribution without any setup. |
Why Use the Volume Profile?
- Identifying support and resistance: The indicator visually marks the price levels where a high volume has historically taken place, while suggesting those areas might act as support or resistance.
- Finding fair value: It helps in pinpointing the price areas where most of the trading has taken place, which can be considered a fair value area where the market has accepted the price.
- Identifying breakouts and reversals: The low-volume areas can indicate potential breakout points, as there is less resistance to the price movement.
- Enhancing market understanding: The distribution of volume across different price levels provides a detailed picture of market activity than traditional volume bars.
Key Components of the Volume Profile Indicator
| Components | Description |
| Point of Control (POC) | It is the price level where the highest volume of trades has occurred during a time period, and is considered the fairest price for the market during that session |
| Value Area (VA) | It marks the price zone that captured roughly 70% of all the trading activity |
| Value Area High (VAH) | It represents the upper boundary of the value area and can behave like a resistance zone when the price is trading beneath it |
| Value Area Low (VAL) | It’s the lower edge of the value area and can serve as a support zone when the price is trading above it |
| High Volume Nodes (NVNs) | These are the peaks or clusters of volume at price levels within the profile |
| Low Volume Nodes (LVNs) | These are the dips or hollow zones on the volume profile that show where trading activity was minimal. |
| Profile High/Low | These mark the highest and lowest price levels, reached during the selected time period of the volume profile |
How Volume Profile Differs from Traditional Volume?
| Feature | Volume Profile | Traditional Volume |
| Data Represented | It shows volume based on price level | It shows volume based on time |
| Data Visualisation | It plots traded volume horizontally along the price axis | It is shown as vertical bars below the price chart |
| Function | It highlights price points based on the intensity of buying and selling activity. | It represents the total trading activity within a time period |
| Insights | It represents the price levels where the majority of buying and selling activity has taken place. | It shows periods of high or low trading activity |
How to Use the Volume Profile Indicator in Trading?
- Identify support and resistance: The traders watch for HVNs on the chart, and when the price reaches these areas, they might behave like support or resistance zones.
- Spot breakout opportunities: The traders use volume profile to anticipate price moves through LVNs, as they have low resistance, and a breakout above an LVN might provide a strong signal.
- Analyse market sentiment: If the price stays within the Value Area, it indicates a balanced market, and a move outside the Value Area can signal a shift in sentiment.
- For entries and targets: The traders usually wait for a price reaction at an area, like an HVN, and then look for a confirmation before entering a trade. The POC of a larger range might serve as a price target.
Pros and Cons of the Volume Profile Indicator
Pros of the volume profile indicator
- Clear market insight: The volume profile indicator provides a clearer understanding of the market dynamics by showing where trading activity is concentrated.
- Customisable: It allows the traders to select different timeframes, ranges, and settings to fit their strategy.
- Data-driven: The information provided is based on actual trading data, which makes it less subjective than some other indicators.
Cons of the volume profile indicator
- Less effective in low volume: The indicator might not provide reliable data in markets with low trading volume, and could lead to noise.
- Historical data only: It is a reactive tool that shows past volume data, and not predictive, which can forecast future direction on its own.
- Manual input needed: The fixed range volume profiles require the users to manually select the range, and can be complex for beginners.
Best Settings for Volume Profile Indicator
The best setting for the volume profile indicator depends on the trading style, risk tolerance, and the personal goals of the traders. Here are some examples of how different types of traders might set the volume profile.
| Trading style | Time frames | Volume profile type |
| Intraday Trading/Scalping | To focus on the current or previous session, these short-term traders might use 1-minute, 5-minute, or 15-minute charts | They might use session volume profile or fixed range volume profile |
| Swing Trading | The swing traders might use 60-minute, 4-hour, or daily charts for analysing the last few days or weeks | They might use the fixed range volume profile or visible range volume profile |
| Long-term Analysis | For longer-term trading, the traders might use the weekly or monthly charts, to look at the market structure over a longer period | They might use visible range volume profile or auto anchored volume profile |
Common Mistakes to Avoid
- Over-reliance on the POC: The POC might be used as a place to initiate a trade, but it’s only the price level where most trading occurs. It acts as a magnet for price or a potential target, and not a guaranteed support or resistance level.
- Ignoring higher time frames: It is important for the trader to analyse the wider market trend on higher time frames to align their strategy. A volume profile analysis without a higher-term trend might lead to false breakout signals.
- Treating it as a stand-alone tool: The traders must avoid basing their entire strategy on the volume profile alone, and always combine it with other indicators like price action, trend lines, the RSI, or MACD for confirmation.
- Misinterpreting low-volume areas: The traders might assume a low-volume area will automatically result in a breakout. These areas might act as breakout zones, but they can also lead to market rejection on the first attempt.
Summary
The Volume Profile indicator measures the traded volume at each price level, helping traders spot where the market showed strong interest or rejection. It highlights the POC, Value Area, HVNs, and LVNs to reveal support, resistance, and fair value zones with more clarity compared to the traditional volume bars.
The traders use it to judge sentiment, plan entries near the reaction zones, and target levels. When the volume profile is paired with trend analysis and confirmation tools, it adds structure, precision, and context to the intraday and swing decisions.
FAQ‘s
The Point of Control (POC) is the price level with the highest traded volume. Value Area (VAH) and Value Area Low (VAL) mark the upper and lower boundaries of the Value Area (VA), which contains around 70% of the total volume. This range shows where the market accepted the price.
The rows decide how detailed the profile looks, and more rows show finer levels, which is considered good for intraday or scalping, while fewer rows give a smoother and wider structure, which is considered better for swing or positional analysis. So the traders should choose based on how much detail they need for entries and exits.
The volume profile indicator works best on 1-minute, 5-minute, or 15-minute charts when paired with either session profiles or fixed ranges. These timeframes help the traders to see where intraday volume clusters formed and how the price reacted around them.
The Volume Profile shows how much volume is traded at each price level, while the Volume Weighted Average Price (VWAP) shows the day’s average price weighted by volume as it moves through time. The Volume Profile highlights the support-resistance zones, and the VWAP acts as a real-time fair-value benchmark.

