After a sharp fall, prices don’t always recover in a straight line. They may pause, bounce slightly, or move sideways, making it hard to judge if the drop is really over. Traders often face a choice: act early and risk more decline, or wait and miss the move. The W pattern breakout offers a clear way to read such situations. It forms when prices attempt a double bottom and break above a critical level, hinting at possible strength. In this blog, we will discuss how the pattern forms and how to use it in trading.
What is a W Pattern Breakout?
A W pattern breakout is a double bottom pattern, where the market forms two distinct lows at nearly the same level, separated by a high point in the middle. This pattern usually appears after a falling price phase and signals a reversal. The breakout occurs when the price moves above the middle high, called the neckline. In breakout trading, this upward move is seen as a sign that selling has reduced and buyers have stepped in, possibly marking the beginning of a new price rise.
How Does a W Pattern Form?
The pattern forms through a defined set of price actions on the chart in the following manner:
- The pattern begins during a declining phase, where sellers push prices down to a fresh low, forming the first bottom of the “W.”
- From this low, prices rebound as buyers enter, creating a temporary rise that forms the middle peak, or neckline.
- Sellers return and pull the price back again. However, this time they fail to break below the first low, and a second trough forms at a similar level.
- As sellers lose steam, buyers step in again and push the price higher. This time, the price breaks above the neckline, completing the W shape and confirming a reversal.
W Pattern vs Double Bottom Pattern
The W pattern and double bottom pattern are essentially the same in structure but differ slightly in how they’re referred to in various contexts. The key elements, formation, breakout level, and trading approach remain the same, but the name used may vary based on interpretation or platform. Here’s how the comparison among the two:
| Feature | W pattern | Double bottom pattern |
| Common use | Visual/chart-based reference | Traditional technical term |
| Appearance | Resembles the letter “W” | Two rounded troughs |
| Structure | Two lows with a middle peak (neckline) | Two lows with a neckline |
| Breakout point | Above the neckline | Above the neckline |
| Market signal | Reversal after a down move | Reversal after a down move |
How to Identify a W Pattern Breakout
In technical analysis, W pattern breakout is identified by observing how the price reacts near support and resistance areas. The steps to identify are as follows:
- The price falls to form the first trough, continuing the ongoing decline.
- It then rises slightly, meeting temporary resistance at the middle of the “W.”
- A second dip forms, but it holds above or near the first trough, creating the second bottom.
- A breakout is confirmed when the price moves above the earlier resistance level, forming the final leg of the pattern.
How to trade W patterns?
To trade a W pattern, wait for confirmation of the breakout above the middle resistance (the neckline).
Here’s a simple approach:
- Identify two consecutive lows forming the “W” shape.
- Draw a neckline across the high between the two lows.
- Enter a long trade once the price closes above the neckline on strong volume.
- Set a stop-loss just below the second low to manage risk.
- Target a profit equal to the height of the pattern projected upward.
This setup works best when combined with indicators like RSI, VWMA, or Volume Spread Analysis to confirm momentum behind the reversal.
Confirming with Volume
A valid W pattern breakout is usually accompanied by a noticeable increase in volume above the resistance (neckline). This increase in volume shows more buying interest and market participation. Volume should be higher than the first and second troughs. If volume is flat or declining during the breakout, the pattern may not be strong and the breakout may not last. In many intraday setups, confirmation is stronger if volume builds up from the second trough and peaks during the breakout candle.
W Pattern Breakout Trading Strategy
To trade this pattern with defined rules for entry, exit and risk, use the following strategy;
- Entry & Exit Rules
One way to enter a trade is after a candle closes above the neckline, confirming the breakout. This means the price has gone past the resistance level between the two dips. A more conservative approach is to wait for a retest, where the price pulls back to the neckline after breaking out. If the neckline now acts as support and the price bounces off it, this can be a better entry point. For exits, the profit target is usually the distance from the lowest point of the W to the neckline. This height is then added to the breakout point to project a logical level to take profits.
- Setting Stop Loss and Targets
Stop loss setting is usually placed below the neckline after the breakout, as this level may become a new support to manage downside risk. If the price goes below this point, it means the breakout has not held. For more protection against a failed setup, the stop loss can be placed below the second dip of the pattern. This wider placement gives room for minor price swings without closing the position immediately.
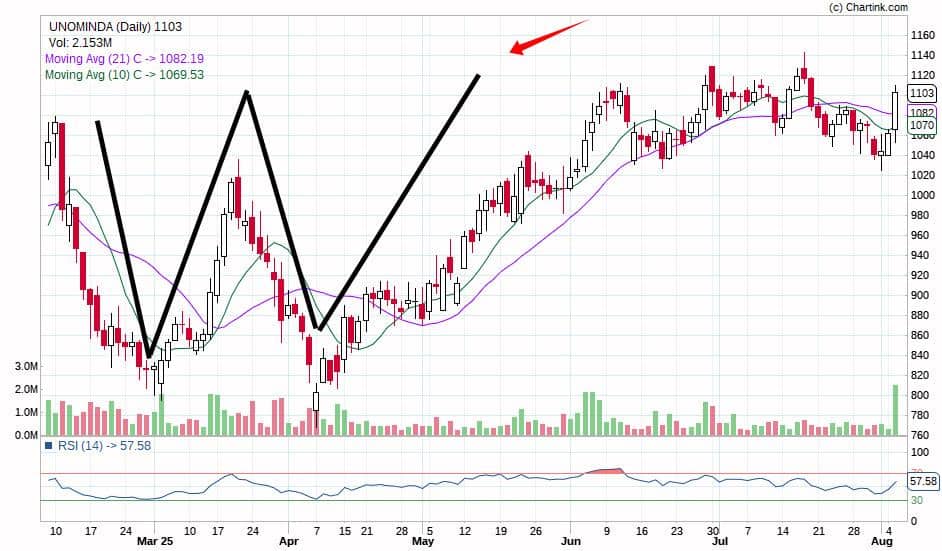
Example Chart of a W Pattern Breakout
To take an example, the daily chart of Uno Minda Ltd. below displays this pattern perfectly. The stock formed a classic W breakout pattern between late March and early May, after which it broke above the neckline and began a sustained uptrend.
Common Mistakes to Avoid
The most common errors traders make with the W pattern breakout are as follows:
- Trading before confirmation: Entering before the price closes above the neckline often leads to failed setups. The pattern is only complete after the breakout.
- Ignoring the previous move: This pattern is valid only after a clear downward move. Using it in a flat or sideways phase increases the chances of error.
- Disregarding volume: Skipping the volume check during the breakout can be costly. A weak volume breakout is less dependable.
- Misplacing the stop-loss: Setting stops too close to the neckline might trigger early exits due to normal price movement. It should be positioned far enough to allow for some fluctuation but still manage risk.
W Pattern vs M Pattern
The W pattern and M pattern are mirror images on a price chart, but they point in opposite directions. While both imply a reversal may follow, they showcase contrasting types of market sentiment and are used in different ways. Here’s how they differ:
| Feature | W pattern (double bottom) | M pattern (double top) |
| Directional bias | Bullish reversal, buyers gaining strength | Bearish reversal, sellers gaining control |
| Market sentiment | Reflects optimism as buyers push prices up | Reflects pessimism as sellers drive prices down |
| Trading strategy | May support long positions or confirm bullish outlook | May support short positions or confirm bearish outlook |
| Preceding move | Forms after a price decline | Forms after a price rise |
| Shape | Two troughs forming a “W” | Two peaks forming an “M” |
| Breakout area | Breaks upward through resistance | Breaks downward through support |
Conclusion
The W pattern breakout is a useful chart pattern when price recovery is unclear. It forms through a repeated price sequence that shows buying interest near support levels. With proper volume confirmation and a clear breakout, the pattern provides a way to manage trade entries, exits and stop loss. Learning to recognize it well can improve your decision making during market reversals.
FAQs
The W pattern is bullish. Also called the double bottom, it forms after a downtrend and suggests that falling prices may be ending, with buyers starting to take control and possibly pushing prices higher.
A W pattern breakout is generally seen as reliable, especially when confirmed by strong volume and occurs after a clear downtrend. However, false breakouts can happen, so many use additional indicators to confirm the signal before acting.
The W pattern works best on daily or longer timeframes, like weekly charts. These reduce random price moves and random fluctuations helping make breakouts clearer and more trustworthy. Lower timeframes can show the pattern, but signals may be less dependable.
Yes, the W pattern can be traded on intraday charts such as 15-minute or 1-hour intervals, but these setups may be less reliable. Intraday patterns are more affected by volatility and market distortion, so extra confirmation is recommended for short-term trades.
A W pattern is a bullish chart formation that looks like the letter “W.” It forms when the price makes two consecutive lows around the same level, signaling that selling pressure is weakening and buyers are stepping in.
The W reversal pattern marks the end of a downtrend and the start of a potential uptrend. The double bottom shows that the market tested support twice but failed to break lower, indicating accumulation and trend reversal.
In a bullish W pattern, the second bottom is higher or equal to the first, followed by a breakout above the middle peak. This confirms that buyers have regained control — often leading to a strong upward move.
After the breakout above the middle resistance, prices typically rise as new buyers enter. Traders often set targets by measuring the height of the pattern and projecting it upward.
It works by identifying market exhaustion and reversal strength. Traders enter after confirmation (breakout above the neckline) and place stop-losses below the recent low for controlled risk.