Every trading day unfolds like a story! Prices rise, fall, and react to pieces of news and emotion in the market. Behind all these movements lies one number that sums up a day’s real action, which is the Average Traded Price (ATP).
Average Traded Price (ATP) is the average of the total turnover and total trade volume of a trading day. While stock prices swing throughout the sessions, this number gives the traders a picture of where buyers and sellers are meeting. It’s what many traders use to measure sentiment, identify price zones, and understand how institutional investors are positioning themselves.
Read this blog to have a better understanding of what is Average Traded Price in the stock market!
1. What is Average Traded Price (ATP)?
The Average Traded Price (ATP) is the average price at which a stock has been bought and sold over a period of time, usually in a single trading day.
The average traded price is calculated by dividing the total value of all trades, that is, the total turnover, by the total number of shares traded, which is the total volume. This helps the investors to understand the market sentiment, identify support or resistance levels, and measure the behaviour of institutional investors.
Average Traded Price (ATP) = Total Turnover/ Total Volume
For example, the shares of ABC Company had a total turnover of ₹50 Cr in a trading day, and the total volume traded was 10 lakh shares.
So, here, Average Traded Price (ATP) = ₹50,00,00,000/10,00,000 shares = ₹500 per share
2. Why It Matters for Traders & Investors
- Indicator of Market sentiment: If the current price of a stock is trading above its ATP, it indicates a bullish sentiment, and if it’s below, it may indicate a bearish sentiment.
- Trading decisions: Investors might use the ATP as a benchmark. If the price moves above the ATP, it may be seen as a probable entry point for the buyers, while a price falling below could be a point for the sellers.
- Institutional activity: The ATP provides insights into the trading patterns of large players who use it as a point for their bulk trades.
3. How to Calculate Average Traded Price
Average Traded Price can be calculated using the Simple Average and Weighted Average methods. Let’s see how they differ from each other in terms of results!
3.1 Simple Average vs Weighted Average
| Parameters | Simple Average | Weighted Average |
| Calculation | It sums up total turnover and divides by total trades per period, and gives equal weightage to each data point. | It multiplies each price by its corresponding volume, sums the products, and then divides the sum by the total volume traded. |
| Volume | It does not consider the volume or quantity of shares traded at each price point. | It accounts for the volume of each transaction, which gives more impact to trades with higher volume. |
| Accuracy | It is less accurate and can be misleading, especially in volatile markets or when volumes differ between trades. | It provides a more accurate view of the average price, which is useful for the institutional investors as well as day traders. |
3.1 ATP Formula Example
The Weighted Average Traded Price is calculated as,
Weighted ATP = ∑(Price per share x Volume of Trade)/Total Volume
Let’s understand with an example:
A trader made the following trades for stocks in a trading day:
| Trade | Price per share (₹)(1) | Volume of trade(2) | Total traded value (₹)(1) x (2) |
| 1 | 100 | 100 | 10,000 |
| 2 | 102 | 50 | 5,100 |
| 3 | 105 | 200 | 21,000 |
| 4 | 103 | 150 | 15,450 |
| TOTAL | 500 | 51,550 |
So here,
Step-1: Calculate the Total traded value = 10,000 + 5,100 + 21,000 + 15,450 = ₹51,550
Step-2: Calculate the Volume of trade = 100 + 50 + 200 + 150 = 500 shares
Step-3: Weighted ATP = ₹51,550/500 shares = ₹103.10 per share
4. Relation to Volume-Weighted Average Price (VWAP)
The Average Traded Price (ATP) and Volume-Weighted Average Price (VWAP) both represent the average price of a stock based on the traded volume, while the difference is in timing and use.
The ATP is a static figure, which is calculated after the trading session ends, and shows the overall average price at which all the trades were executed during the day. The VWAP, on the other hand, is a continuing indicator that updates with every trade throughout the trading sessions. It reflects the running average of prices weighted by volume up to a continuous point in time.
In short, VWAP is a live, intraday version of ATP. The traders use VWAP for intraday decisions, while the ATP helps to analyse the overall market sentiment once the session ends.
ATP is usually calculated as VWAP and is considered a standard in financial markets because it accounts for the volume of each trade, providing a more accurate reflection of the true average market price.
5. Practical Uses: Live Snapshot & Trading Strategy
The chart below shows Bharti Airtel’s 1-day in 1-minute interval price movement, on 12 November 2025, with the Volume Weighted Average Price (VWAP) indicator.
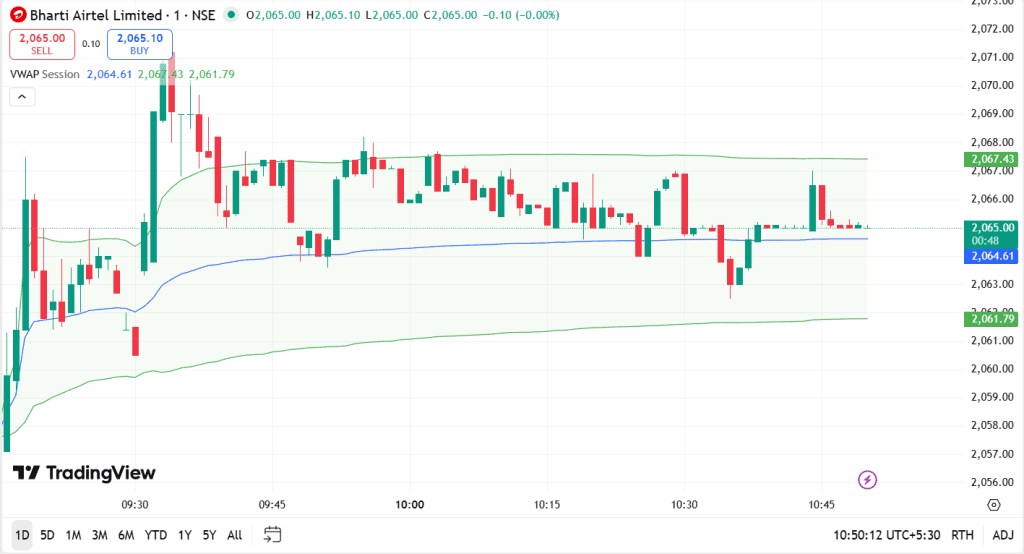
So, what does this chart depict?
- The blue line is the VWAP, and it represents the average trading price based on both price and volume.
- The green lines above and below it reflect the upper and lower VWAP bands, marking potential resistance and support zones.
- It can be seen that after a quick rise around 9:30, the price mostly moved sideways, drifting close to the VWAP line at ₹2,064 to ₹2,065.
- This means the market stayed balanced, and neither the buyers nor the sellers were in strong control during this period, and traders might wait for a clear breakout above or below VWAP with volume to catch the next directional move.
6. Common Misconceptions & Mistakes
- Confusing ATP with Volume-Weighted Average Price (VWAP): A common error is assuming ATP and VWAP are the same. The ATP is a simple average of all trade prices, treating each trade equally. While the VWAP weights prices by volume, which is a more accurate measure, as it reflects where most capital was traded.
- Relying Solely on ATP for Trading Signals: The new traders might end up using only ATP for buy or sell decisions, which can be misleading. The traders should confirm signals with other tools like support and resistance levels, fundamentals, and risk management to avoid any false trends.
- Ignoring the Time Factor and the Impact of Large Trades: The ATP doesn’t account for when trades occur. The larger trades could disrupt it, which will show a false view of the day’s overall sentiment.
7. Regional/Indian Context & Platform Details
In the Indian financial markets, on the exchanges like the National Stock Exchange (NSE) and the Bombay Stock Exchange (BSE), the ATP or VWAP is an indicator of:
- Intraday Benchmark: It reflects the average cost at which shares were traded throughout the day, giving a view of market activity.
- Market Sentiment: If the current price of a stock is above the ATP or VWAP, it indicates a bullish sentiment, and if it is below, it suggests a bearish sentiment.
- Institutional Use: The large institutional investors and mutual funds use the VWAP as a benchmark to execute large orders, with an aim to buy below or sell above the average price to minimise market impact.
Conclusion
Understanding the Average Traded Price (ATP) helps traders to interpret the market sentiment and refine their trading strategies accordingly. It helps them to identify where the buyers and sellers are most active in context to price movements.
When it is combined with tools like VWAP, it becomes even more powerful for planning entries and exits. Moreover, clearing up the common misconceptions regarding ATP allows the traders to make better, confident trading decisions.
FAQ‘s
The Average Traded Price (ATP) is the mean of the prices at which a stock is bought and sold during a trading session, showing where most trades occurred.
The Average Traded Price is calculated by dividing the total traded value by the total number of shares traded.
Average Traded Price (ATP) = Total Turnover/ Total Volume
The ATP is the average price of all trades in a trading day, while the closing price is the final price at which the last trade happens before the market closes.
The ATP varies on a trading day because new trades occur at different prices and volumes, and each trade affects the total value and volume, which shifts the average price accordingly.
The VWAP is a live indicator of the ATP. While the ATP is calculated after the session ends, the VWAP updates continuously during trading hours based on the price and volume.
The ATP includes all executed trades, including both buying and selling, as each transaction represents one buyer and one seller at an agreed price.
The traders use the ATP to measure market sentiment and identify potential entry or exit zones. The price above the ATP suggests a bullish momentum, while the price below the ATP indicates bearish momentum.