
The Nifty slipped by 2% after almost reaching a record high in November 2025, due to uncertainty in the Indian-US Trade deal and fading hopes of the December rate cut by the US Federal Reserve. But what do the analysts say?
Some traders might assume pullback as a balanced and healthy correction in a wider uptrend. A pullback is usually a temporary price correction in an overall asset’s price trend, which allows investors to buy quality stocks during the price dip.
To leverage more such pullbacks, like the Nifty, read this blog to understand what a pullback is in trading, how to identify pullbacks, and what the strategies are for trading pullbacks.
What is pullback in trading?
A pullback in trading is a temporary price correction in the overall price trend of an asset. It is a strategy to capitalise on short-term reversals. The investors and traders look for pullbacks to enter a market at a lower price or to buy during a brief dip in an uptrend, or to sell when an uptrend begins to go down, with the expectation that the original trend will resume soon.
In short, a pullback is
- A temporary reversal: It’s a short-term pause or move in the current uptrend, and not a complete trend reversal.
- A common occurrence: The stock markets moving in a straight line is unheard of, so pullbacks are frequent in all markets, including stocks, forex, and commodities.
- An opportunity: Investors and traders see these pullbacks as a chance to enter a trade at a better price point before the trend continues.
Identifying Pullbacks
A pullback will show decreased volume and will eventually resume the original trend, unlike a reversal, which shows a more permanent shift in the direction of the price trend.
- Identify the main trend: Before spotting a pullback, investors must first identify the primary trend, that is uptrend or a downtrend. A pullback is a move against the trend. Therefore, knowing the trend is essential for further context.
- Use technical indicators: Investors can use technical indicators, such as moving averages, fibonacci retracements, to identify possible support or resistance levels where a pullback might end.
- Observe price action and volume: For this, investors may utilise the candlestick patterns and observe the change in trade volume, as a pullback is usually accompanied by a noticeable drop in trading volume.
- Distinguish from a reversal: The pullbacks are short-lived, lasting only for a few sessions, while reversals are more significant and long-term. A pullback stays within the boundaries of the trend line, whereas a reversal will break through it.
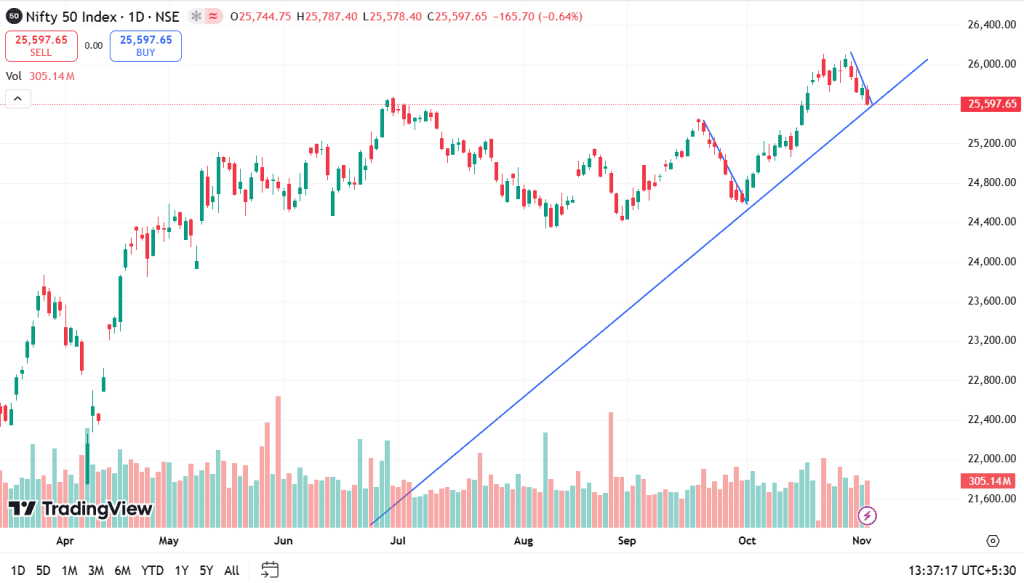
For example, the Nifty dip of 2% after touching the 26,000 mark shows mild profit booking in November 2025. However, the index remains in an overall uptrend, with support around 25,400–25,500 and resistance near 26,000. The pullback appears to be a short-term correction, not a reversal, reflecting healthy consolidation after the recent gains.
Pullback vs. Trend Reversal
This table provides a clear view of how pullbacks differ from trend reversals:
| Features | Pullbacks | Trend Reversal |
| Duration | Pullbacks are short-term, and last only for a few sessions or candles. | Reversal or long-term, and last for weeks or months. |
| Market Structure | It continues the existing trend of high highs or lows and lower highs or lows. | It breaks the existing trend, and forms lower lows. |
| Trade Volume | Here, trade volume decreases, which indicates profit booking rather than sentiment change. | Here, the trade volume increases significantly, indicating institutional accumulation. |
| Causes | Short-term factors such as news, profit-booking drives pullback. | Fundamental factors such as economic condition, financial reports drive reversal. |
| Opportunity | It offers the opportunity to enter a trade at lower price in the uptrend direction. | It ends an old trend and starts a new one, indicating traders to take position in the opposite direction of the trend. |
Strategies for Trading Pullbacks
Here are some strategies investors might utilise for trading pullbacks:
- Trend Identification: The first step is to identify the main trend, uptrend or downtrend, using higher timeframes, for example, daily charts for swing trading, to avoid market noise.
- Identifying Entry Points: Next, wait for the price to pull back to technical levels that act as support in an uptrend, or resistance in a downtrend.
- Entry Triggers and Confirmation: Traders might not enter a trade until the pullback shows signs of ending and the original trend is resuming, or wait for the price to break a minor resistance or support level formed during the pullback.
- Risk and Trade Management: It requires effective risk management to avoid mistaking a pullback for a full trend reversal. Traders can set stop-loss, position sizing, and profit targets to avoid chasing trades or making emotional decisions.
Tools and Indicators
For efficient pullback trading, combining several tools and indicators is essential to identify a pullback rather than assuming a trend reversal.
| Tools and Indicator | How do they help? |
| Moving Averages | These are used to confirm the main trend direction and to provide support and resistance levels |
| Fibonacci Retracement | It uses a series of horizontal lines at key mathematical ratios to identify price reversal areas |
| On-Balance Volume (OBV) | It measures the buying and selling pressure by adding volume on up days and subtracting volume on down days |
| Relative Strength Index (RSI) | It measures the speed of change in price movements to identify overbought or oversold conditions of an asset |
| Moving Average Convergence/Divergence (MACD) | It shows the relationship between two moving averages of a stock’s price, which helps traders to identify trend direction, momentum, and entry/exit points through line crossovers and divergences |
Bottom line
The pullbacks are a natural and recurring phase in market trends, which is seen as a healthy correction rather than a warning sign. For investors and traders, it’s an opportunity to enter trades at better price levels within the existing uptrend.
Therefore, recognising pullbacks early and combining them with technical analysis can help to balance risk and reward more effectively.
FAQ‘s
A pullback in trading is a short-term decline or correction in an asset’s price within the ongoing trend. It takes place after a steady rise or fall , which allows investors to enter or exit positions at more favourable prices before the main trend begins to continue.
A pullback shows a brief move opposite to the main trend, along with reduced trading volume. Traders can identify it by spotting price dips that stay within the trend line and resume movement in the original direction, unlike reversals that break through the trend.
No, pullbacks are temporary and short-lived, lasting only for a few sessions, while a trend reversal is a long-term change in direction. Additionally, pullbacks stay within the trend’s structure, whereas reversals break it entirely.
Traders can wait for the pullback to approach the support or resistance levels, confirm reversal signals using indicators, and enter trades once the main trend begins to resume. They might manage risk through stop-loss orders and position sizing to avoid losses.
The technical indicators, such as Moving Averages, Fibonacci Retracement, RSI, MACD, and On-Balance Volume (OBV), help traders identify the existing trend, find support or resistance zones, and confirm when a pullback might end.