
The study of markets demands observation, patience, and method. Among the technical tools developed for this purpose stands the ‘Displaced Moving Average’, a modified form of the traditional moving average constructed to improve the visual study of price movement.
In technical analysis, averages are employed to smooth fluctuations and reveal a trend’s direction. The displaced moving average (DMA) differs by shifting the calculated average either forward or backward on the chart. This displacement helps the investors to observe trend alignment, filter short-term disturbances, and evaluate entry or exit zones with greater structure.
Read further to know about the Displaced Moving Average, why it is used in the stock market, and DMA examples.
What is a Displaced Moving Average?
Moving averages are a lagging indicator, meaning that they give a delayed reaction to price changes. Moving averages will start trending much later than the price. To solve this problem, a displaced moving average is used.
A displaced moving average means shifting the moving average forward or backward in time (or shifting it right or left on the price graph). When the moving average is displaced left or backward, it is called negative displacement. When it is moved forward or right, it is called positive displacement. A displaced moving average can be created using any type of moving average.
For example, when analysing an uptrend, technical analysts move a simple moving average left (backward) to superimpose it on the price action. This helps in clearly seeing the direction of the trend and possible support and resistance levels.
Why is DMA used in the Stock Market?
In the stock market, DMA is used for high-volume trading, allowing immediate, anonymous, and precise control over trade execution.
- Trend identification: The DMA helps in defining the existing market direction by visually aligning price with its underlying trend structure.
- Noise reduction: By shifting the average forward or backward, DMA filters short-term fluctuations and reduces minor price disturbances.
- Entry & exit refinement: The traders use DMA positioning to identify structured entry points, breakout confirmations, and potential reversal zones.
- Support & resistance: In trending markets, the displaced average usually acts as a moving reference level where the price reacts systematically.
How does DMA work?
The DMA adjustment improves the visual alignment with price action without changing the original calculation method. Here’s how DMA works:
- Calculation base: A DMA is first calculated in the same manner as a standard moving average, using a selected time period and price type, such as the close price.
- Displacement mechanism: After calculation, the average is shifted forward or backward on the chart by a fixed number of periods. The formula remains unchanged, and only its plotted position is altered.
- Forward displacement: When shifted ahead, the DMA visually projects trend structure that helps the traders to compare current price action with past average behaviour.
- Backward displacement: When shifted behind, the DMA smooths the past price action and highlights how strongly the price has moved relative to its average.
Displaced Moving Average Example
In this 1-hour chart of Trent Limited, on 12 February, three Displaced Moving Averages are plotted to study trend structure.
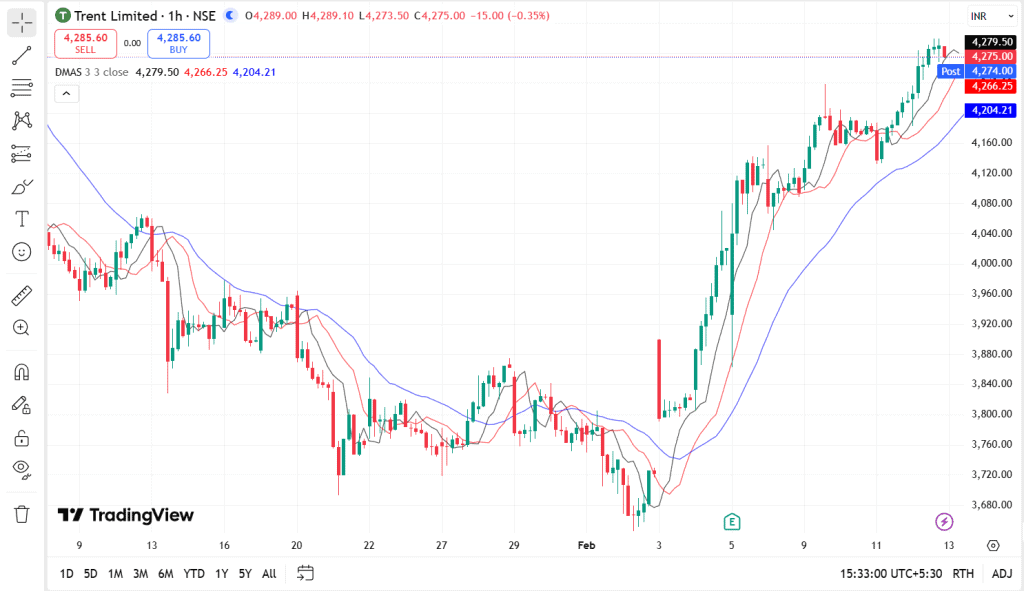
In this chart, each line represents a different time sensitivity:
- The blue line is the longer-period DMA, which moves gradually and reflects the larger market trend. When the price sustains above it, the primary direction is considered bullish, and when the price is below, a bearish pressure dominates.
- The red line represents a medium-period DMA. It reacts faster than the blue line and often acts as dynamic support or resistance during trending phases.
- The grey line is the shortest-period DMA. It closely follows price movement and highlights immediate momentum shifts, which offer early signals within the larger trend framework.
What does DMA indicate?
In the stock market, DMA refers to a shifted moving average that smooths price action to identify trends, support, resistance, and potential reversals.
- Trend direction: The position of the price relative to the DMA reveals whether the existing structure is upward or downward.
- Momentum intensity: The degree of separation between the price and the DMA reflects the strength of the ongoing move.
- Reaction levels: In trending phases, the DMA usually operates as a moving support in uptrends and a moving resistance in downtrends.
- Shift in structure: The crossovers between the price and the displaced average may indicate weakening trend conditions or the early development of a reversal.
DMA vs EMA
The DMA and Exponential Moving Average (EMA) differ in responsiveness and calculation. Let’s break it down:
| Basis of Comparison | DMA | EMA |
| Definition | A standard moving average shifted forward or backward on the chart | A weighted moving average that gives importance to recent prices |
| Calculation Method | Uses SMA or EMA formula, then shifts the plotted line in time | Uses an exponential formula that increases weight on latest data |
| Sensitivity to Price | It depends on chosen period, and the displacement does not change sensitivity | It is more responsive to recent price changes than SMA |
| Purpose | It improves visual alignment and trend structure analysis | It captures short-term momentum and reacts to price moves |
| Primary Use | It identify trend alignment, support, resistance, and structure | It identify faster trend changes and crossover signals |
| Lag Nature | It retains the lag of its base average (SMA or EMA) and only shifts its visual position | It reduces lag compared to SMA by assigning greater weight to recent prices |
Pros and cons of the Displaced Moving Average
| Pros | Cons |
| It provides earlier trading signals when forward displaced, as it aligns closer to current price action. | It still remains a lagging indicator since it is derived from historical data |
| It functions as a support or resistance level during trending phases | It generates frequent false signals in sideways or range-bound markets |
| It smooths short-term price fluctuations, improving trend visibility | It requires careful selection of period and displacement, increasing subjectivity |
| It offers adaptability across timeframes and volatility conditions | It cannot be relied upon independently without confirmation from other tools |
Conclusion
The displaced moving average is a refined variation of the traditional moving average, which is designed to improve trend interpretation. By shifting the average forward or backward, it enhances the visual alignment without altering its fundamental calculation. This makes DMA useful for identifying trend direction, support, and resistance, and structured entry or exit points.
However, it remains a lagging indicator and performs best when combined with complementary tools. Therefore, proper parameter selection and contextual analysis are essential for the effective application of DMA in trading practice.