Table of contents
When it comes to trading charts, understanding chart patterns will give you a competitive edge in the marketplace.
Take an upside-down “U”-shaped graph for example, that indicates price fluctuations and a rounding top chart pattern. A rounding top suggests a bullish security trend, whereas a rounding bottom usually indicates a reversal in the long-term price fluctuation.
In this article, we will look at the meaning of the rounding bottom chart pattern, how to identify one, and how to trade a rounding bottom.
What is a rounding bottom pattern?
The rounding bottom pattern is made up of a neckline resistance level and a rounding bottom U shape.
The rounding bottom pattern indicates the end of the present downturn and a possible beginning of an upswing.
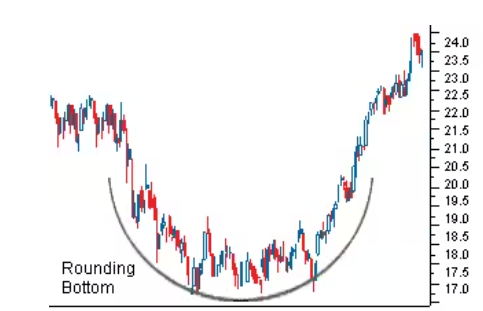
The pattern, however, continues to decline further before the price stabilises and forms a rounding bottom. The price eventually rises above the stabilised area’s neckline. This marks the end of the pattern.
How does a rounding bottom pattern function?
While a rounding bottom lacks the “handle” portion’s temporary downward tendency, it still has a similar shape to the bullish cup and handle pattern. A rounding bottom’s first downward slope indicates an oversupply, which pushes down the price of the stock.
As more people enter the market at a lower price and demand for the stock grows, the market shifts to an upward trend.
Once the rounding bottom is completed, the stock resumes its new upward trend after breaking out.
How can I identify a rounding bottom pattern?
- The buildup to the stock’s initial decline towards its bottom can be observed by the previous high in the trend.
- When the stock price levels off and gets closer to the bottom of the pattern formation, the trading volume remains at its lowest.
- Investors buying back into the stock results in the volume rising as the stock bounces back and continues to finish the pattern.
Breakdown of the rounding bottom pattern
Downtrend: A consistent decline in the value of a security or asset is the first indication of a pattern.
Rounding curve: As the market levels out and begins to create a smooth rounding curve, the downturn continues. The saucer-like look is usually created by a gradual curvature.
Support line: This is the lowest price that was attained during the pattern creation and is found at the bottom of the rounding bottom. Usually, this support line lies flat or has a slight upward slope.
Resistance line: The highest point of the saucer’s curvature is where the resistance line is drawn. It stands for a level that the price found it challenging to break above when the pattern was forming. Additionally, the resistance line is usually level or has a slight downward slope.
Volume: As the rounding bottom pattern develops, volume tends to decline, signifying a reduction in selling pressure. This volume decline indicates that sellers, or bears, may be losing control of the market.
Breakout: If the price breaches the resistance line, the pattern is said to be finished. This breakout of the rounding bottom pattern suggests that the previous downtrend may be recovering and might start a new uptrend.
Trade rounding bottom: Here’s how
When the declining price trend stabilises for some time before starting to rise again, you may consider that the pattern has developed.
If the volume traded is higher during a price decline, flat during price stability, or rising during a price increase, this indication gets strengthened.
Drawing the neckline (a line connecting swings in a pattern) is the next thing to do once the pattern has been verified. Traders may consider booking a long position whenever the stock price breaks through the neckline.
When the price reaches the target price, most traders exit their positions.
Conclusion
In conclusion, the rounding bottom pattern is created when the price of a security hits a new low, goes horizontally, and then rebounds. This rounding bottom pattern, when correctly identified, could prevent traders from selling in a market that may not be advantageous.
FAQs
The rounding bottom pattern is a bullish reversal pattern that typically occurs after a prolonged downtrend. It indicates a shift from a bearish trend to a bullish one.
To predict bullish or bearish trends, you can use technical analysis tools such as chart patterns, indicators, and trend lines. For example, the rounding bottom pattern can signal a potential bullish reversal when the price breaks out above the resistance level that forms the peak of the rounding bottom.
There is no definitive answer to this question, as different patterns may have different strengths and weaknesses depending on the context and the market conditions. However, some of the commonly used bullish patterns are the cup and handle, the ascending triangle, the flag, and the double bottom.
The accuracy of the rounding bottom pattern depends on several factors, such as the duration of the pattern, the volume confirmation, the price target, and the stop-loss order. Generally, the longer the pattern, the stronger the signal.
Similar to the previous question, there is no definitive answer to this question, as different patterns may suit different traders’ styles, preferences, and objectives. The best trading pattern is the one that matches your trading plan, risk tolerance, and market analysis.