Table of contents
Making informed choices is essential while trading in the stock market. Consider not only your own risk appetite and trading goals but also the factors that could affect the stock prices you’re analysing. To achieve this goal, candlestick patterns are quite helpful.
One such candlestick pattern is a tweezer candlestick that comes in two variants. Traders can trade tweezer top and bottom strategies according to their trading styles. Today we will talk about the tweezer bottom candle and how you can trade this pattern. Let’s get started.
What are tweezer bottom candlestick patterns?
When two consecutive candlesticks have identical highs or lows, it is called a tweezer pattern. One kind of tweezer pattern is the tweezer bottom candlestick pattern, while the other is the tweezer top candlestick pattern.
A tweezer bottom forms after a bearish trend has progressed to a certain point. If the pattern’s bottom point gets tested once or more, it’s apparent that bulls won’t let prices drop much lower. Although it is commonly seen as a two-candle pattern, this arrangement usually includes more candles.
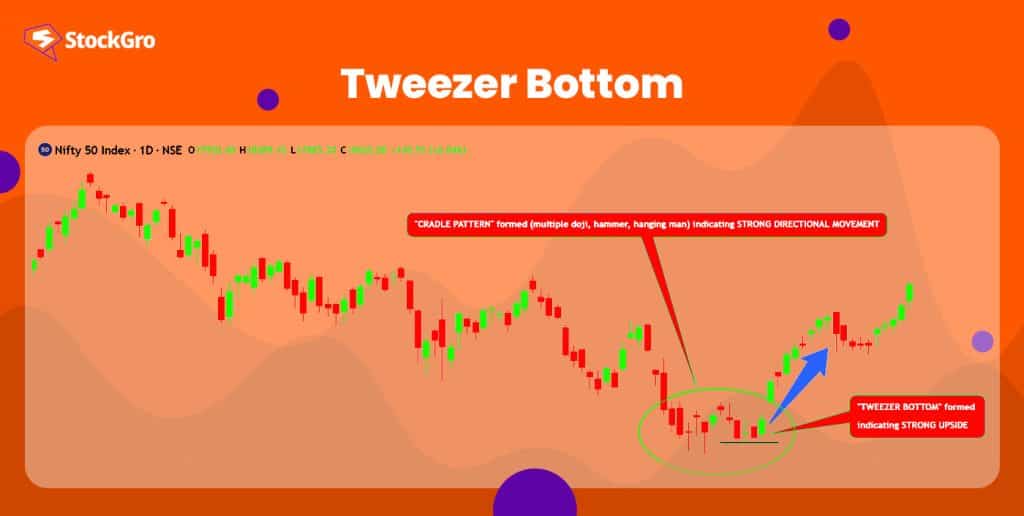
In tweezer bottoms, the only thing that matters is that the first candle’s low point is well-defended and intact. A tweezer pattern, in its most basic form, is a bullish reversal signal, meaning that a positive trend is about to begin.
How to identify a tweezer bottom candle?
When prices reach lower lows near the end of a downturn, a tweezer bottom forms. As a trader, you may recognise the tweezer bottom candlestick pattern on a technical chart by looking for specific indications.
Some of these features are:
In most cases, a bearish initial candlestick indicates a downward trend. A candlestick like this will be either red or black. The second candlestick is usually a positive indicator, showing that an uptrend is starting.
Here, market expectations lead to the formation of a bearish candlestick as the initial candlestick in this pattern. When this pattern develops close to the support levels, traders’ attitudes shift and buyers initiate buys. This kind of shift causes bullish candlesticks to appear, which means that price bulls have taken over.
In other words:
- The size, wick, and market behaviour of the first candle determine its character, which can be bullish or bearish.
- The bottom pattern’s second candle might be bullish or bearish as well, but it might go back to the low of the first candle without breaking it.
- The tweezer bottom pattern can last for more than one candle if prices keep retesting the low without going below it.
Tweezer bottom candlestick: What does it mean?
It is necessary to presume that the market is presently experiencing a negative trend, wherein excessive supply and low demand are further pushing the market down, to comprehend what tweezer bottom tells us about the market.
At first glance, the formation of the tweezer bottom candle’s initial candle might look ordinary. The candlestick makes a new low, retraces slightly, and finally closes on a high note. Now, when a second candle forms, you can see the shift since it closes just above the preceding candle’s low point rather than breaking it.
This way, it appears that the bulls have regained enough power to defend a prior low, which is a positive indicator, even if they have been sidelined for a while.
How to trade a tweezer bottom candlestick?
Upon identifying a tweezer bottom pattern on a technical chart, you may execute specific trading strategies to earn profits. Some possible approaches are listed below:
- Signifying a change in the current trend
The emergence of the tweezer bottom pattern is a reliable indicator of a possible downtrend reversal. This pattern might be seen as an indication to move out of your current short position or to initiate a new long position.
- Setting a stop loss at the low of the second candle
The stock reaches a support level when the two candlesticks in a tweezer bottom pattern have identical lows. If the price breaks below this support level, it may mean the reversal signal was a failure. For this reason, when you start a long position, you may set your stop loss at the low of the second candlestick.
- Using the volume indicator to verify
Combining the tweezer bottom pattern with additional technical indicators and chart patterns might help validate it. If you want to see if the tweezer bottom is significant, you may check the volume indicator. An increase in volume during the creation of the bullish candlestick indicates the confirmation of the trend reversal from a downtrend to an uptrend.
Conclusion
When a tweezer bottom candlestick pattern forms, the market sentiment has become positive. A new long position or an exit from an existing short position might be a good idea at that moment. You must, however, double-check your decisions using additional technical indicators to avoid any losses.
FAQs
After a tweezer bottom pattern, the market often experiences a bullish reversal. The pattern suggests that selling pressure has subsided, and if the price breaks above the second candle’s high, it typically confirms a trend change to the upside.
The 5 candle rule is a trading strategy that looks at the patterns of five consecutive candles on a chart. Traders use this rule to predict future price movements, with the fifth candle serving as a confirmation of the trend or a signal for reversal.
The psychology behind a tweezer top pattern is tied to market sentiment and trader reaction at key price levels. When two consecutive candles form with similar highs, it indicates that buyers are unable to push the price higher, suggesting that bullish momentum is waning.
To identify a tweezer top, look for two adjacent candlesticks that have nearly the same high point during an uptrend. The first candle is typically bullish, showing continued buying pressure. The second candle, however, is bearish, indicating that buyers are losing control and sellers are starting to take over.
For a tweezer top, sell when the low of the two candles is breached, using the high as a stop loss. For a tweezer bottom, buy when the third candle rises above the second, placing a stop at the bottom of the second candle.