The Dow theory, also referred to as the Dow Jones theory at times, was founded by Charles Dow in the 1990s. He published the theory in parts in The Wall Street Journal, which became prominent after his death when other editors of the journal compiled all the theories together.
One of the early theories in the stock market world, the Dow theory, is said to be the pioneer of uptrend and downtrend concepts in the stock market that help in analysing the price movement of stocks.
What is the Dow theory?
Dow theory in technical analysis uses stock market indices to determine the market’s movements. It believes the market is in an uptrend if an index breaks the resistance level and moves upward, followed by another index following the same pattern. Both price and volume are tracked for the Dow theory analysis.
Understand the workings of Dow theory.
Below are the 6 principles of Dow theory:
- The market discounts everything.
The primary principle works on the efficient market hypothesis. It suggests that a stock’s market price is a mirror of all its past and present trends. It is believed that the movement of share prices suggests everything about a stock’s behaviour and is one of the critical parameters for investors to study the market.
The hypothesis works on the idea that stock prices and stock market indices are extremely volatile. So, the stock prices and indices react rapidly to any unforeseen event that occurs in the market.
- The three market trends.
According to this principle, the market moves in three different trends.
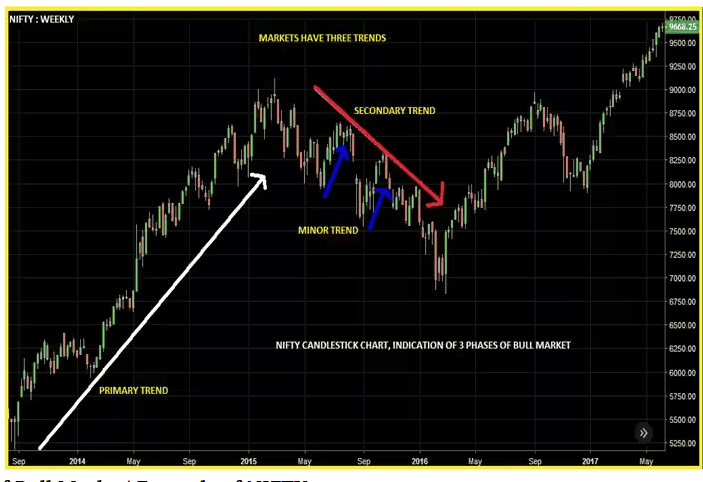
- Primary trend: This is the dominant market trend. It suggests whether the market is bullish or bearish. Retail investors in the stock market generally keep track of the primary trend to move in the same direction to benefit from stock price movements. These trends are usually long-lasting.
- Secondary trend: The secondary trend is a short-term corrective action. These trends move against the dominant trend. In a long-term bullish market, the secondary trend is bearish for a few weeks until the market picks up again, and vice versa.
- Minor trend: Minor trend, as the name suggests is minor, meaning it lasts for a very short period, generally less than one day. These trends are unreliable as the movement is based on market rumours.
- The three market phases
According to the Dow theory, both upward and downward market trends go through three different phases, where they form the support and resistance levels.
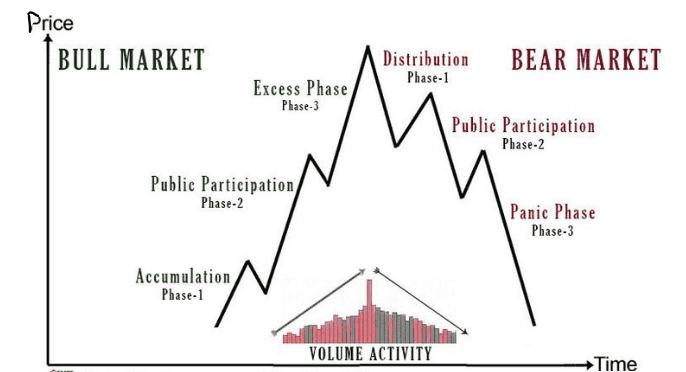
Phase 1: The accumulation phase
In this phase, the stock prices reach their lowest points. Despite the low prices, investors don’t invest in these stocks as they doubt the stock’s capability to perform well. So, the stock continues to stay at low prices.
At this point, large investors enter the market to create a support level. They buy the stocks in multiple quantities to create a demand for them and thereby increase the stock’s price.
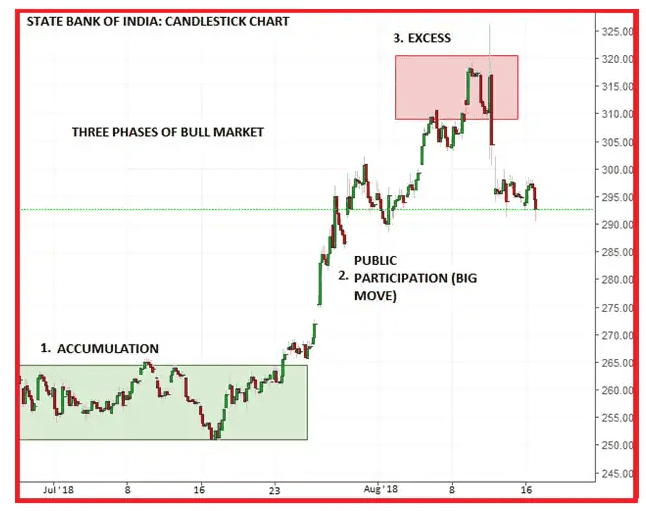
Phase 2: The phase of public participation
Once the retail investors notice the increasing stock price, they develop confidence in the stock’s performance and invest in it.
The increase in demand leads to the stock’s price rising further, and the bearish market starts getting bullish. The stock’s performance continues to attract more investors until the price reaches its peak.
Phase 3: The distribution phase
Also called the excess phase, this phase is the opposite of accumulation. At this juncture, where the prices are at their maximum, investors enter the market to sell their shares.
The selling of shares leads to an increase in supply, causing a reduction in prices and creating a resistance level. The reducing trend marks the beginning of a bear market again.
- Indices must follow each other.
The next principle of the Dow theory states that all stock market indices must follow each other to ascertain a market trend. For example, if SENSEX shows an upward trend, NIFTY should project the same pattern, too. Otherwise, it may not be an accurate indication of an upward market.
- Price and volumes must move together.
This principle states that the price and volume must have a coordinated movement. The volume of a stock must follow its primary market trend and move in the corresponding direction.
In a bullish market, price and volume must move upward together. In a market that is primarily bearish, the volume must increase as the price reduces. It basically suggests that the increase in volume must be based on the primary trend and not the secondary trend.
- Secondary trends are not reversals.
The secondary trend, as per the Dow theory, moves in the opposite direction of the primary trend, looking like a reversal. Charles Dow suggests that the market should be assessed based on the primary trend unless there is a clear indication of a reversal.
The relevance of Dow theory
Though the theory was formed over a century ago, it is still considered relevant in today’s stock market, as most investors prefer trading in the direction of the stock.
Since the theory uses a long-term perspective to analyse market trends and lays out the principles to follow during analysis, it is said to be easy and beneficial for investors.
Despite the benefits, the Dow theory is subject to criticism as investors feel that the theory does not consider a broad approach to analyse market movements.
Market movements may depend on various external factors like political and economic situations. Hence, judging the market’s future movement based on past trends alone may not always be accurate.
How does Dow Theory work?
Dow Theory is a technical analysis framework that suggests market trends are driven by broad movements in prices. It focuses on three trends: primary trends (long-term), secondary trends (medium-term), and minor trends (short-term). It uses price action of stock indices, particularly the Dow Jones Industrial and Transportation averages, to identify trend changes and confirm market movements.
Importance of Dow Theory
Dow Theory helps traders identify long-term market trends, offering insights into market reversals, confirmations, and the overall trend direction. It serves as the foundation for much of modern technical analysis, guiding decisions in trading and investing.
Six Tenets of Dow Theory
- Market prices move in trends: Trends are the foundation of market movement.
- Market trends have three phases: Accumulation, public participation, and distribution.
- Stock market indices must confirm each other: Both industrial and transportation averages should move in sync.
- Volume must confirm the trend: Volume increases during strong trends.
- Trends exist until signals show they have reversed: A trend is assumed to continue until proven otherwise.
- The discounting mechanism: All information, including news and events, is reflected in prices.
Pros of Dow Theory
- Trend Identification: Helps identify long-term trends.
- Foundation for Technical Analysis: Forms the basis for much of modern technical analysis.
- Clear Signals: Provides a structured approach to identifying reversals and confirmations.
- Applicable Across Markets: Can be used in various markets, including stocks, commodities, and forex.
Cons of Dow Theory
Subjective Interpretation: Its principles can be interpreted differently by different traders.
Lagging Indicator: Dow Theory is reactive, which means it may signal trends after they’ve started.
Complex for Short-Term Trading: It focuses on long-term trends, which may not be ideal for short-term traders.
No Exact Entry/Exit Points: It provides broad trend guidance but doesn’t offer specific buy or sell signals.
Bottomline
The Dow theory is one of the significant indicators for the technical analysis of the stock market. It is generally considered an accurate tool that determines past trends of a stock. However, it is always better for investors to combine this tool with other technical indicators that provide an all-around picture of the market to analyse the future movements of stocks.
FAQs
Investors use the Dow theory to track market trends. The theory shows the dominant trend and the secondary and minor trends. Analysing these long-term and short-term trends in parallel can help traders plan profitable strategies.
Dow theory is one of the most important tools of technical analysis. It was invented even before candlestick charts and has been aiding in informed trading decisions. Dow theory considers prices and volumes to identify trends in various market conditions.
Dow Jones Industrial Average is a stock market index named after Charles Dow and Edward Jones, indicating the performance of the top 30 stocks listed on the NYSE and NASDAQ. Investors use the index for a high-level analysis of the U.S. economy.
The primary disadvantage of dow theory is its slowness. Investors do not find this theory suitable in a fast-paced market as opportunities are lost by the time the theory suggests future trends based on past data.
The secondary trend in Dow Theory is a medium-term trend that moves against the primary trend. It typically lasts from 3 weeks to 3 months and is seen as a correction or consolidation before the primary trend resumes.
Dow Theory is a framework for analyzing market trends, based on the principles established by Charles Dow. It identifies primary, secondary, and minor trends in the market to help traders understand long-term market movements and reversals.
The principles of Dow Theory include:
Market trends move in three phases: Primary, secondary, and minor.
Indices must confirm each other: Both industrial and transportation indices should move in sync.
Volume confirms trends: Volume increases in the direction of the trend.
Trends persist until reversed: A trend is assumed to continue until proven otherwise.
The market phases in Dow Theory are:
Accumulation Phase: Smart money buys when the market is undervalued.
Public Participation Phase: Widespread buying as the market rises.
Distribution Phase: The trend ends as the market peaks and smart money starts selling.
Charles Dow Theory is the foundational set of principles for market analysis developed by Charles Dow, co-founder of the Dow Jones company. It focuses on the idea that stock prices move in predictable trends and that these trends can be identified and followed.
The minor trend in Dow Theory refers to short-term fluctuations or price movements within the secondary trend. It typically lasts from a few days to a few weeks and has less significance in determining the overall market direction.