Summary
The Average True Range (ATR) indicator measures the volatility of a stock or market over a set period.
Higher ATR values indicate larger price movements, while lower values indicate stable, less volatile conditions.
Traders use ATR to set stop-loss levels, manage risk, and determine optimal trade sizing based on market volatility.
Price movements rarely follow a smooth or predictable path. Markets can stay quiet for a while and then shift sharply without much warning. Knowing how much prices usually move can be just as useful as knowing the direction they are taking. Average True Range helps explain this behaviour by giving context to market volatility.
This guide covers what Average True Range is, how it’s calculated, what it shows about price movement, and how it’s used in trading.
What Is the Average True Range (ATR)?
Average True Range, often referred to as ATR, is a technical indicator that focuses on the extent of price movement over a specific period. Rather than pointing in a direction, it shows whether the market is active or calm.
ATR was developed by J. Welles Wilder Jr., who introduced it in his book New Concepts in Technical Trading Systems. While it was originally created for commodities, traders later found it equally useful for stocks, indices, and currencies.
In simple terms, ATR answers one core question: “How much does this asset usually move?”
Average True Range (ATR) Formula
To find the ATR, the following formula is used:
ATR = (Previous ATR × (n − 1) + True Range) / n
where n = number of periods, and True Range is the maximum of:
- Today’s High − Today’s Low
- Today’s High − Previous Close
- Today’s Low − Previous Close
How to Calculate the ATR
Looking at a simple numerical example helps show how everyday price movements gradually come together to form the ATR value.
Step 1: Collect price data
Consider a stock with the following values:
High: ₹860, Low: ₹845, Previous Close: ₹852, n = 14 days
These three values are required to calculate the True Range.
Step 2: Calculate the True Range (TR)
Now, calculate the three possible price ranges and identify the largest one.
High − Low = 860 − 845 = ₹15
High − Previous Close = 860 − 852 = ₹8
Low − Previous Close = 845 − 852 = ₹7
Among these, ₹15 is the highest value. So, the True Range (TR) = ₹15
This value represents the actual price movement for the day, including gaps.
Step 3: Calculate the first ATR value
Next, calculate the ATR for the first 14 days.
Assume that the sum of True Range values for the previous 14 days is ₹168.
First ATR = 168 / 14 = ₹12
This means that, on average, the stock moved ₹12 per day over the last 14 trading sessions.
Step 4: Calculate the ATR for the next day
Now update the ATR using the ATR formula.
Previous ATR = ₹12, Current TR = ₹15
Then, the ATR = (12 × 13 + 15) / 14
ATR = (156 + 15) / 14
ATR = 171 / 14 = ₹12.21
The updated ATR of ₹12.21 shows that volatility has increased slightly compared to the earlier period, reflecting a marginal rise in daily price movement.
What Does the ATR Tell You
ATR reflects how active the market is over a given period. When it rises, price movement increases, and when it falls, conditions are generally calmer.
It does not show direction, so high ATR can appear during rallies, sell-offs, or sudden shifts.
Low ATR often points to consolidation, where prices move within a tight range for a while. These phases are closely watched because they can precede larger moves.
ATR helps traders understand whether current price action is unusually active or relatively stable compared to the past.
Example of How to Use the ATR
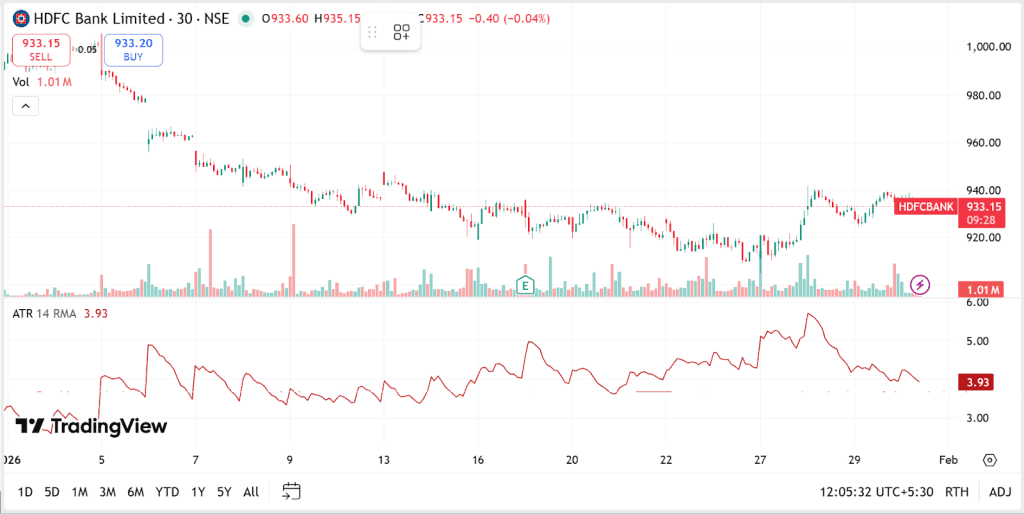
In the shown chart, HDFC Bank is trading around ₹933, and the ATR (14) value is 3.93. This means the stock typically moves about ₹4 per day under current market conditions.
- Using ATR for stop-loss:
With an ATR (14) value of ₹3.93, a reference distance of about 1.5 times ATR comes to roughly ₹6, placing the stop-loss level near ₹927 when the price is around ₹933. - Setting realistic expectations:
An ATR close to ₹4 indicates that price movement is typically limited to a similar range, making much larger short-term moves less likely. - Reading changes in volatility:
ATR falling from above ₹5 to around ₹3.9 shows volatility is cooling, and price movement is becoming more controlled.
Advantages of ATR
ATR has many advantages that make it a valuable tool for trading:
- Shows Real Price Movement
ATR highlights how far prices typically move within a given period, helping align expectations with actual market behaviour. - Adjusts as Conditions Change
When markets turn fast or slow down, ATR responds naturally without needing frequent recalibration. - Useful Across Time Horizons
ATR can be used on different time frames, making it suitable for both short-term and long-term approaches. - Improves Risk Planning
By aligning decisions with typical price swings, ATR supports better stop placement and position sizing.
Limitations of the ATR
While ATR is effective for measuring volatility, it also has practical constraints that can affect how it is applied.
- Does Not Signal Market Direction
ATR measures volatility only and does not indicate whether prices are likely to move upward or downward. - Requires Historical Comparison
A single ATR reading has limited meaning unless it is compared with earlier values of the same asset. - Lagging in Nature:
ATR is based on past price movements, which means it reflects changes in volatility after they have already occurred. - Not Suitable for Every Strategy
Strategies that rely heavily on direction, timing precision, or predictive signals may find ATR insufficient on its own.
How Do You Use an ATR Indicator in Trading?
ATR is mainly used to understand how much a stock usually moves and to adjust trading decisions according to current market volatility rather than price direction.
Placing Stop Losses
ATR helps set stop losses at a distance that reflects normal price movement, reducing exits caused by routine fluctuations.
Managing Position Size
When ATR is high, prices swing more, so reducing position size helps control risk. Lower ATR allows relatively larger positions.
Reading Market Activity
A rising ATR signals increasing market activity, while a falling ATR suggests calmer or consolidating conditions.
Setting Realistic Trade Targets
ATR shows the typical price range, helping traders avoid unrealistic profit expectations within a short period.
Conclusion
Average True Range looks at how markets behave when prices start moving faster or slow down unexpectedly. It shifts attention away from guessing direction and toward understanding real price behaviour. This makes risk easier to understand and helps keep expectations realistic. When used alongside other tools, ATR adds clarity to decisions.
FAQs
There is no single best ATR value that works for all assets. What matters is how the current ATR compares with its past levels and how it fits with the trading or investing approach being used.
ATR is commonly calculated using 14 periods by default. However, this range is often adjusted according to the time frame and trading strategy.
Stop-loss levels are typically set at 1.5 or 2 times the indicator value, so they adjust with changing market volatility and leave room for normal price movement.
Average daily range looks only at how far the price moved between the day’s high and low. ATR goes a step further by factoring in gaps from the previous close, giving a broader view of how prices actually behave across trading sessions.
ATR moves up and down over time, but it is not a true oscillator like RSI or MACD. It measures market volatility rather than price direction or momentum.