Table of contents
Price movement comes with trading opportunities in the financial markets. Traders need technical analysis tools to identify potential price movements and understand how to capitalise on them.
For technical analysis, candlestick formations stand out for their ability to provide a clear message of approaching trend reversals. One of the powerful candle patterns is the bullish engulfing with its distinct visual representation.
In this article, you can understand the power of a bullish engulfing candlestick pattern and how to interpret signalled price reversal.
What is the bullish engulfing pattern?
Bullish Engulfing signals trend reversal, appearing at downtrend bottoms with two candles.
As the name suggests, an engulfing candle pattern is when a candle in a price chart completely engulfs or covers the previous candle. The first candle reflects the recent trend’s colour (red), while the second candle (green) is of the opposite colour and suggests a potential reversal of the ongoing trend.
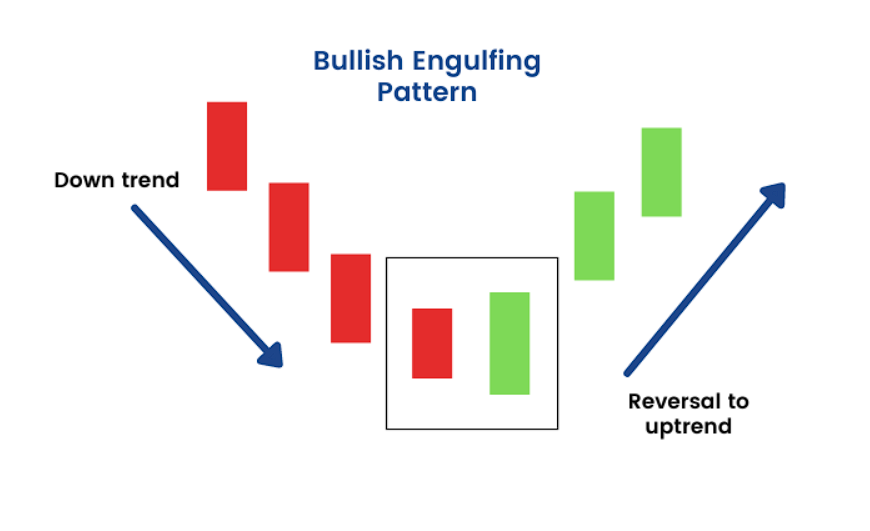
The bullish engulfing candle typically appears after a long downward price trend. This downtrend sets the stage for an approaching trend reversal, indicating reduced selling pressure and a rise in buying pressure. It triggers more buyers to enter the market, leading to a further price rise.
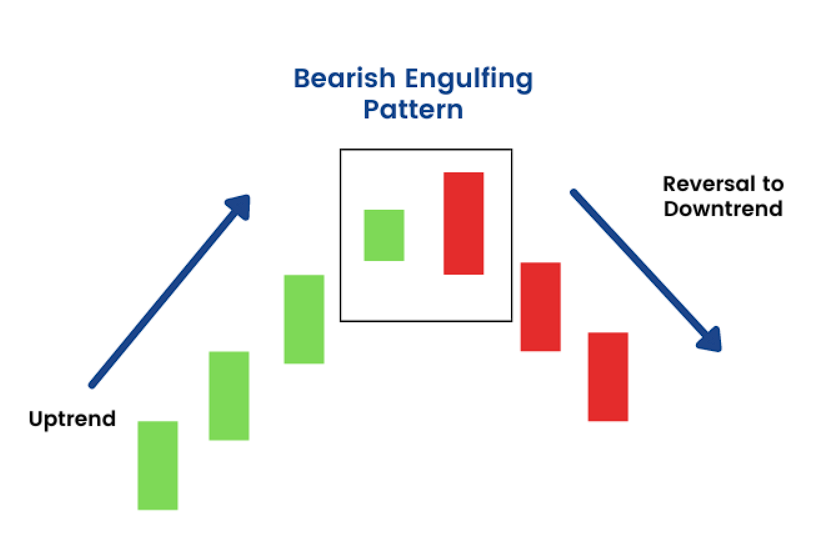
Bullish vs. bearish engulfing pattern
A bearish engulfing pattern signals a bearish reversal that suggests a potential price fall as sellers take charge. This pattern emerges at the top of an uptrend. It is characterised by the force of selling pressure exerted by sellers.
This pattern triggers a reversal of the existing trend, prompting an inrush of sellers that drives the price downward.
Components of bullish Engulfing Candle pattern
First candle:
The first or previous candle in the bullish engulfing pattern is the bearish one of a downtrend. This bearish candle indicates that the opening price is higher than the closing price.
Traders look at the body size to get a signal. A large-sized body indicates a significant fall in price during the specified time frame, representing an existing downtrend.
Also Read: Between bulls and bears: The power of the flag pattern in trading
Second candle:
The second candle is bullish in the bullish engulfing pattern. It engulfs the first candle’s body (bearish candle). It means this bullish candle opens lower than the closing price of the first candle.
But, when it closes, it is above the first candle’s opening price. The second candle’s body is typically longer than the first, indicating a significant change in market sentiment.
Interpretation and signals
The bullish engulfing pattern is used to spot early price shifts and market sentiment. Here is how bullish engulfing is interpreted:
- Market sentiment: Simply, it can have a huge impact on market sentiment as it can prompt traders to take positions, expecting a price increase. The bullish engulfing pattern illustrates changing market sentiment from a bearish outlook to a bullish one.
A sharp price direction shift represents buyers’ increased control and potentially reversing the existing downtrend. - Candle size for confirmation: The candle size in every candlestick pattern matters and enhances the reliability of the signal. In the engulfing pattern, a larger bullish candle than the prior bearish candle indicates a significant change in prices and a shift in market sentiment.
A large-sized bullish candle represents that buys have significantly overcome the sell, marking a strong bullish reversal.
How to trade a Bullish Engulfing pattern?
As traders recognise a bullish engulfing pattern, they often initiate long positions (buying securities with expectations of price rise), buying the asset with the expectation that the price will rise. The pattern’s occurrence suggests holding the securities for future sale at a higher price.
It is essential to note that traders do not solely rely on the bullish engulfing candles to avoid any lack of flexibility in their trading strategies. They consider diversifying analysis methods with other crucial market signals to mitigate the risk.
Often, they find a bullish engulfing pattern, a strong signal, when the red candle is a doji or the following candles close above the high of the bullish candle.
Example
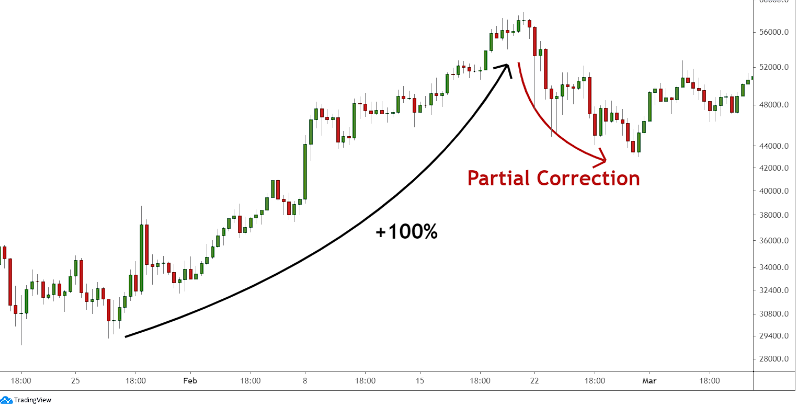
As previously mentioned, the bullish engulfing pattern appears at the end of a downtrend, signifying the potential new uptrend. A trend reversal implies that there is the need for a correction of an upward trend first. In the provided chart, you can observe an upward trend (from January to February) that led to a 100% surge in price.
Chart 1
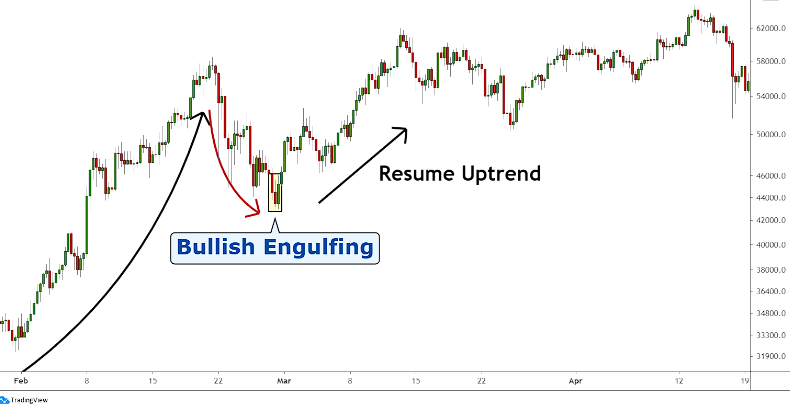
Subsequently, a trigger is required to reignite the previous upward movement. In chart 2, notice how the price swiftly surged after a short-term move against the prevailing trend (partial retracement) on February 28th.
Observe how the bullish candle engulfed the preceding candle completely, an indication of a bullish reversal.
Chart 2
Conclusion
The bullish engulfing pattern is a crucial concept in technical analysis to forecast potential price trends and market shifts based on historical market data.
By recognising this pattern and understanding its implications, traders can stay ahead of their counterparts to benefit from market shifts.
Combine its signs with other analysis tools or techniques and boost its effectiveness.
FAQs
A bullish reversal in trading can be identified by a sharp drop in price followed by a period of consolidation, a break above a key level of resistance, and an increase in buying volume. It’s crucial to confirm these signs with other technical analysis tools.
A reversal candle can be spotted by its unique features such as long wicks, small bodies, or specific formations like engulfing patterns. It’s important to consider volume, as reversals are stronger when accompanied by a surge in volume, showing conviction behind the move.
The bullish engulfing pattern reflects a sudden bullish surge after a downtrend, signaling discomfort for bears. It suggests that the selling pressure has diminished, and buyers have regained control, driving prices higher. This pattern indicates a potential shift from a bearish to a bullish trend.
To confirm a trend reversal, traders often use various technical indicators. Volume and momentum indicators are commonly used. Other indicators include candlestick patterns, moving averages, and the Relative Strength Index (RSI). These tools help assess the strength and direction of price movements.
The 3 Candle Strategy is a simple yet effective trading strategy used in any market. It’s based on the premise that once three consecutive bullish or bearish candles form, momentum is starting to swing accordingly. This strategy is often used to predict future price movements