Table of contents
In the high-stakes game of investing, there’s a term that can make even the most seasoned traders break into a cold sweat: capitulation.
Understanding capitulation is like having a secret weapon in the world of finance. It offers valuable insights into market psychology and assists investors in navigating the frequently volatile financial markets.
Discover the intriguing realm of capitulation and how it influences trading techniques in this article.
Understanding capitulation
Picture this: a stock you’ve invested in has plummeted by 30%. You’re confident it will bounce back, so you hold on. Then it falls another 20%. You’re still hopeful, maybe even buy more on the dip. But then, in a single day, it plunges another 15%.
It suddenly becomes clear to you: you’ve made the wrong choice. This is surrender – the point when optimism turns into disappointment, and investors quickly sell their shares out of fear.
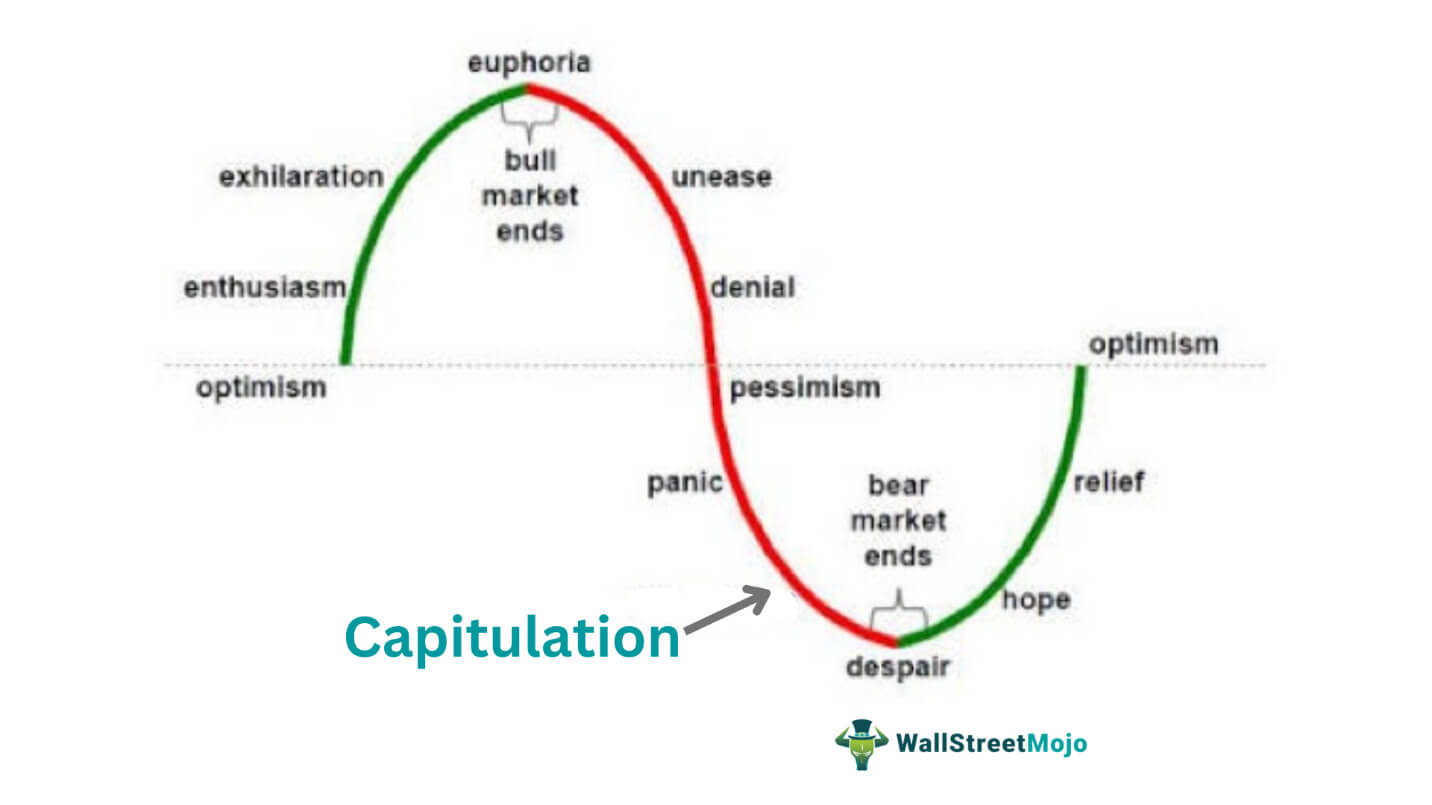
But what does it mean? In simple terms, capitulation is a term used in the world of finance and investing to describe a point in time when investors are rapidly selling off their positions, typically at a loss. This mass sell-off usually occurs when investors perceive that the market is taking a turn for the worse, and they want to exit their positions to avoid further losses.
The concept of capitulation is rooted in behavioural economics. It’s a reflection of the fear and panic that can grip the market in times of extreme volatility. When a significant number of investors capitulate, it can lead to sharp and sudden price declines.
Capitulate vs recapitulate
Capitulate is a term frequently used to describe the moment when investors, overwhelmed by fear and panic, choose to sell off their stocks to prevent additional losses. It feels like giving in to the negative forces of the market.
However, recapitulation does not pertain to an action in the market but rather serves as a review or summary. Recapping the day’s market events and summarising key movements and trends is common in a trading context.
The causes of capitulation
Capitulation usually happens when the price of a stock keeps going down. This can happen for several reasons, including:
Bear market: In a bear market, prices decline and the economy usually experiences a downturn, which can result in capitulation. Investors might consider selling their holdings to mitigate any additional losses.
Poor earnings results: A drop in stock value could occur if a company’s reported earnings are lower than expected. If the sell-off is extensive and investors lose confidence in the company’s future profitability, it can result in capitulation.
Negative company or market headlines: Adverse developments regarding a company or the broader market can trigger investor anxiety, leading to a rush to sell their shares. This can result in capitulation if the news is especially negative or unforeseen.
Identifying capitulation
Recognising capitulation in the financial market can be challenging, but some specific signs and indicators can assist. Here’s how you can identify capitulation:
Unusually high trading volume: An indicator of capitulation is often seen in a significant surge in trading volume. This occurs when a significant number of investors choose to liquidate their holdings simultaneously.
A sharp price decline: Capitulation is usually accompanied by a significant drop in the price of a security. This is a result of the widespread selling that takes place during capitulation.
Negative sentiment: The general sentiment of investors can also suggest a state of capitulation. During periods of widespread pessimism, there is a tendency for investors to engage in large-scale selling.
Rebound in price: The price going back up after the panic selling is over is the clearest sign that people have given up.
A capitulation trading strategy can help identify these signs. This strategy involves looking for indicators of capitulation and making trading decisions based on these indicators.
The aftermath of capitulation
After giving up, the market can become quite unpredictable and unstable. Once the intense selling pressure subsides, the bulls might be cautious about entering the market, resulting in volatile price fluctuations as the market seeks a new balance.
Market capitulation Is frequently viewed as an indication of market bottom or exhaustion, as it implies that the majority of the hesitant or anxious participants have left the market.
Following the capitulation, certain traders and investors who were patiently awaiting a bottom might begin to perceive value in the low prices, which could result in a potential reversal or a period of consolidation.
Bottomline
Capitulation occurs when there is a prolonged decline in prices, leading investors to sell their positions and accept losses rather than risk further decline in their assets.
Identifying a capitulation before it occurs can be quite challenging. However, given the indication of capitulation, it suggests that the market has reached its lowest point and is likely to experience a turnaround.
Excessive selling can cause the price to decline, presenting opportunities for bullish traders to purchase at lower prices. It is expected that this will eventually lead to an increase in the market.
Learn to identify the signs of a market bottom and understand investor behaviour during extreme downturns. For a deeper dive into market capitulation and other essential stock market concepts, visit the StockGro app.
FAQs
Capitulation is neither inherently good nor bad; it’s a market phenomenon reflecting investor psychology. It can be seen as bad because it’s driven by panic selling, often leading to significant losses for investors. However, it can also be seen as good, as it often signals a market bottom, providing potential buying opportunities for investors who believe a recovery is imminent. Understanding capitulation can help investors navigate market volatility.
Accumulation in finance refers to a period when an asset is being bought up or “accumulated” by investors. It’s often identified by a general increase in buying activity and rising prices. Key indicators include increased trading volume and positive trends in technical analysis. The Accumulation/Distribution (A/D) line, a technical indicator that uses volume and price, can also help identify accumulation.
Capitulation doesn’t have a set duration. It can last from minutes to a month. The length of a capitulation period can vary based on the market and the severity of the sell-off. For instance, the Great Recession of 2008 lasted 18 months, but it took several years for the economy to recover completely. Identifying capitulation with certainty is possible only after it has occurred and the price has rebounded.
The Power of 3 in trading refers to a strategy that involves three key elements: accumulation, manipulation, and distribution. It’s a candlestick/bar formation relevant for all timeframes, especially within daily and weekly trading ranges. The opening price is considered the beginning of the period. Understanding this model is a fundamental skill for trading disciplines such as swing, short-term, and intraday trading.
The Dow Theory, developed by Charles Dow, is a cornerstone of technical analysis. It asserts that market movements are not random but move in identifiable trends and patterns. The theory predicts the market is in an upward trend if one of its averages advances above a previous important high, accompanied or followed by a similar advance in another corresponding average. This approach forms the core of the modern technical analysis.