Table of contents
- Dark Cloud Cover Candlestick Pattern: Meaning & Formation
- How to Identify the Dark Cloud Cover Pattern in Trading
- Dark Cloud Cover Trading Strategies: How to Use It Effectively
- Common mistakes to avoid
- How Reliable is the Dark Cloud Cover Pattern?
- Dark Cloud Cover in Forex vs. Stock Market: Does It Work the Same?
- Bottomline
- FAQs
The capacity to foresee shifts in market sentiment is a crucial skill for success or failure in the ever-changing trading industry. Candlestick pattern analysis is one potent method that traders use to read market signals. One of these patterns, the dark cloud cover, is particularly noteworthy for its accuracy and predictive capabilities.
To spot possible bearish reversals in the market, this fascinating pattern, with its ominous name, is essential. A trader’s toolbox can be greatly expanded by learning about the dark cloud cover and what it means, as this knowledge can offer invaluable insights into the dynamic market environment.
This article explores the intriguing realm of dark cloud cover and its crucial function in technical analysis.
Dark Cloud Cover Candlestick Pattern: Meaning & Formation
A bearish reversal is indicated by the dark cloud cover candlestick pattern in technical analysis. This pattern may indicate a market reversal when it emerges during an uptrend.
The formation of the dark cloud cover candlestick pattern requires two days.
A lengthy green (or white) candlestick indicates a strong upward movement in the market on the first day. At the start of the second day, the price is higher than it was at the end of the first day. The market closes within, but not below, the body of the candlestick from the previous day, and the price falls as the day goes on.
The term “dark cloud cover” comes from the fact that this produces a candlestick that covers the one from the day before, giving the impression of a cloud.
When market sentiment changes, it shows as a dark cloud cover candlestick. An upward trend at the outset indicates that purchasers are in charge. But sellers have begun to step in, as the second day’s downward movement shows. The second day’s higher opening could be interpreted as the final upward push before the trend reversal.
How to Identify the Dark Cloud Cover Pattern in Trading
The dark cloud cover can be located in a candlestick chart by learning to recognise its unique features. This is an in-depth explanation:
Uptrend: As market prices rise, a pattern known as the Dark Cloud Cover appears. In other words, prices have been on the rise up until the pattern appeared.
Two candlesticks: Two candlesticks make up the pattern
- Prices rose throughout the time frame indicated by the first candlestick, which is bullish (green or white).
- The second candlestick is bearish (red or black), showing that prices decreased.
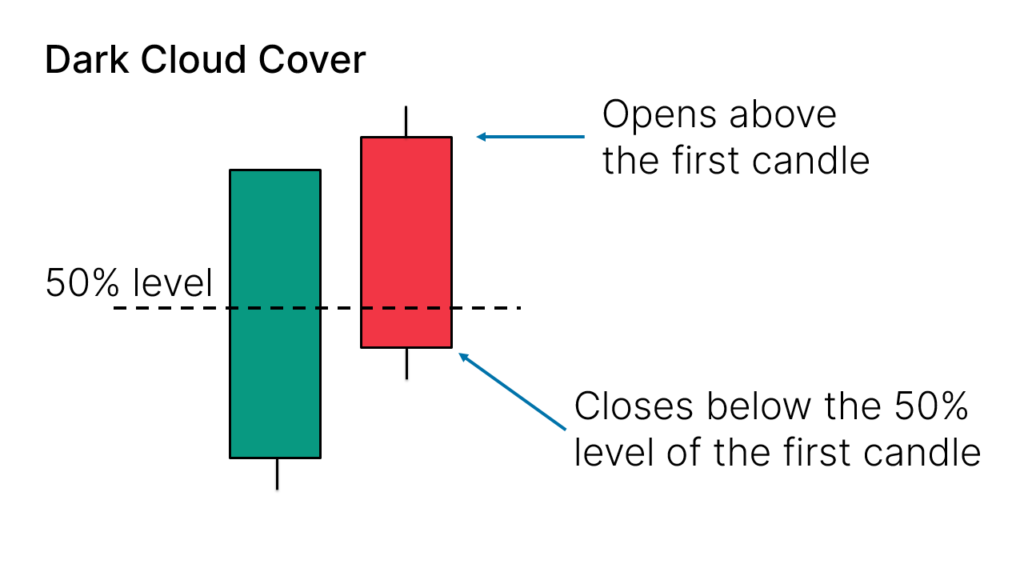
Higher open: The first bullish candlestick closed at a higher price than the second bearish one did at the opening. From the previous close, this is typically perceived as an upward gap.
Lower close: Closed within the first candlestick’s body, but not below it, is the second candlestick. The second day’s closing price is lower than the opening price, even though it’s higher than the first day’s closing price.
Candlestick chart analysis software is a common tool for traders in the real world when looking for patterns like the dark cloud cover. To aid traders in spotting patterns, these tools can highlight them on the chart. To confirm the pattern’s existence and make educated trading decisions, though, familiarity with its features is essential.
Dark Cloud Cover Trading Strategies: How to Use It Effectively
Making calculated moves is essential when trading under the dark cloud cover. It may be time to get in a short trade or get out of a long position if this pattern develops, as it suggests a possible bearish reversal with dark clouds.
For the dark cloud cover bearish pattern, the best time to enter is at the bottom of the following candle’s opening range. As a result, the dark cloud bearish reversal is confirmed.
If the price unexpectedly rises, you can limit your potential losses by setting stop-loss levels just above the high of the dark cloud cover pattern. The ideal level of take-profit can be found by analysing past data or using a risk-reward ratio.

Nevertheless, additional market factors must be taken into account to confirm. A couple of examples of such indicators are the moving average convergence/divergence (MACD) and the relative strength index (RSI).
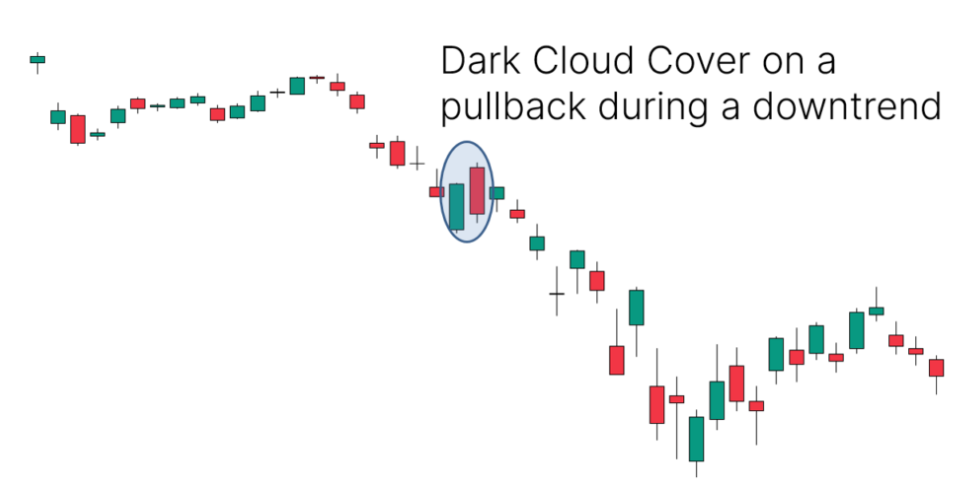
An example of how the dark cloud cover can perform in the favour of short traders
Common mistakes to avoid
Trading on the pattern alone: Dark Cloud Cover is an effective signal, but it can still be wrong. Traders should constantly look for confirming signs from other patterns or indicators.
Ignoring the trend: During an uptrend, this pattern appears, signalling a bearish reversal. You risk getting false signals if you trade it when it’s downtrending.
Misidentifying the pattern: The two-candle bearish pattern is not always a Dark Cloud Cover. Using the pattern’s unique traits to positively identify it is of the utmost importance.
Key Differences Between Dark Cloud Cover & Bearish Engulfing
| Aspect | Dark Cloud Cover | Bearish Engulfing |
|---|---|---|
| Structure | The bearish candle closes below the midpoint of the previous bullish candle but does not engulf it. | The bearish candle completely engulfs the previous bullish candle. |
| Strength of Bearish Signal | Moderate – needs confirmation from the next candle. | Strong – often signals immediate bearish momentum. |
| Volume Consideration | High volume on the second candle strengthens the reversal signal. | Works best when the second candle has significantly higher volume. |
| Best Trading Setup | Works well when near resistance levels. | More reliable in highly volatile markets. |
Which One is More Reliable?
- Bearish Engulfing is stronger because it fully absorbs the bullish candle, confirming seller dominance.
- Dark Cloud Cover requires additional confirmation, such as a bearish follow-through candle or volume increase.
How Reliable is the Dark Cloud Cover Pattern?
Why Do Traders Use Dark Cloud Cover?
- Appears at the peak of an uptrend, signaling a potential trend reversal.
- Helps traders spot selling opportunities early before a larger downtrend begins.
Reliability Factors
| Factor | Impact on Reliability |
|---|---|
| Volume Confirmation | High volume on the bearish candle strengthens the reversal signal. |
| Next Candle Confirmation | A bearish close after the pattern increases reliability. |
| Market Context | Works best when appearing near resistance levels or after overbought conditions. |
| Supporting Indicators | More reliable when combined with RSI (Relative Strength Index) and MACD divergence. |
When is Dark Cloud Cover Less Reliable?
- Weak market trends: If the uptrend is not strong, a Dark Cloud Cover may not result in a full reversal.
- Low trading volume: Without significant volume, the bearish signal may not hold.
- Absence of confirmation candle: A bullish candle after the Dark Cloud Cover invalidates the pattern.
Trader’s Tip:
Always combine Dark Cloud Cover with technical indicators like RSI (overbought condition) or MACD to strengthen your analysis.
Dark Cloud Cover in Forex vs. Stock Market: Does It Work the Same?
Dark Cloud Cover in Stock Market
- Works well in stocks with strong uptrends, especially when near resistance zones.
- Earnings reports and market news can influence the pattern’s effectiveness.
- Best confirmed with trendlines, moving averages, and volume analysis.
Dark Cloud Cover in Forex Market
- Forex is highly liquid and volatile, so patterns like Dark Cloud Cover can appear frequently.
- Works best on higher timeframes (1-hour, 4-hour, daily) to filter false signals.
- Must be combined with macroeconomic factors like interest rates and central bank policies.
Key Differences Between Stock & Forex Trading with Dark Cloud Cover
| Factor | Stock Market | Forex Market |
|---|---|---|
| Liquidity & Volatility | Moderate to high, varies per stock. | Very high, especially in major currency pairs. |
| Effectiveness | Reliable when near resistance zones. | Works best when paired with key price levels and fundamental analysis. |
| Confirmation Needed? | Yes, with volume and moving averages. | Yes, with trend indicators and support-resistance analysis. |
Does Dark Cloud Cover Work the Same?
- In stocks, volume plays a bigger role in confirming the pattern.
- In Forex, liquidity and economic news can overshadow the pattern, making confirmation with technical analysis essential.
Bottomline
When an uptrend is about to end, the Dark Cloud Cover can be a strong indicator of a bearish reversal. But you must know its unique features and use it alongside other indicators for it to be truly effective. Like any trading strategy, it takes practice to become perfect.
Want to master stock trading? Learn from SEBI-registered experts, access real-time market insights, and practice risk-free with virtual trading. Start learning investment strategies app today!FAQs
The Dark Cloud Cover and the Bearish Engulfing are both bearish reversal patterns, but they differ in their formation:
Dark Cloud Cover: This two-candle pattern has a bullish candle followed by a bearish candle that opens above the first candle’s high and closes within its body, but not below it.
Bearish Engulfing: This pattern also consists of two candles – a bullish one followed by a bearish one. However, the bearish candle completely engulfs the body of the bullish candle.
The Dark Cloud Cover and the Evening Star are both bearish reversal patterns, but they differ in their formation. The Dark Cloud Cover is a two-candle pattern that occurs during an uptrend. The second candle opens above the first one’s high and closes within its body. The Evening Star, on the other hand, is a three-candle pattern. It consists of a long bullish candle, a small-bodied star, and a long bearish candle.
A Doji is a unique pattern in a candlestick chart used in technical analysis of financially traded assets. It’s characterized by having a small length, indicating a small trading range, with opening and closing prices that are virtually equal or have small differences. This pattern generally signals indecision in the market and can indicate an upcoming price reversal. However, it’s important to consider other patterns and indicators before making a decision.
Trading with a Bearish Engulfing pattern involves a strategic approach. First, it’s important to identify a prevailing bullish trend in the market. The Bearish Engulfing pattern is characterized by a small bullish candle followed by a larger bearish candle that completely engulfs the first. Once this pattern is identified, traders can consider entering a short position when the price breaks below the low of the engulfing candlestick. To manage risk, a stop loss can be set just above the high of the engulfing candle.
The opposite of the Dark Cloud Cover is the Piercing Line pattern. This pattern also consists of two candlesticks, but in this case, the down candle comes first, followed by the up candle. The Piercing Line pattern appears at the end of a downtrend and signals a bullish reversal, indicating a potential increase in stock prices. Like the Dark Cloud Cover, it’s crucial to use the Piercing Line pattern in conjunction with other indicators for confirmation.