Table of contents
Understanding what is top-line and bottom-line growth is critical for both businesses and investors in the world of finance. All of these variables stand for essential measures of a business that show how well it is doing financially and generally.
Revenue, or gross sales, is the top line, while net income, or profit, is the bottom line, which accounts for a company’s financial health after deducting all expenses and taxes.
The article aims to explore these ideas further, illuminating their relevance, the elements that affect them, and ways to improve them.
What Is Top-Line Growth & Why Does It Matter?
A company’s top-line growth, also known as revenue growth, is the rise in its gross sales or revenues. Since it represents the total revenues earned during a specific period which appears at the top of a company’s income statement, it is called the top line.
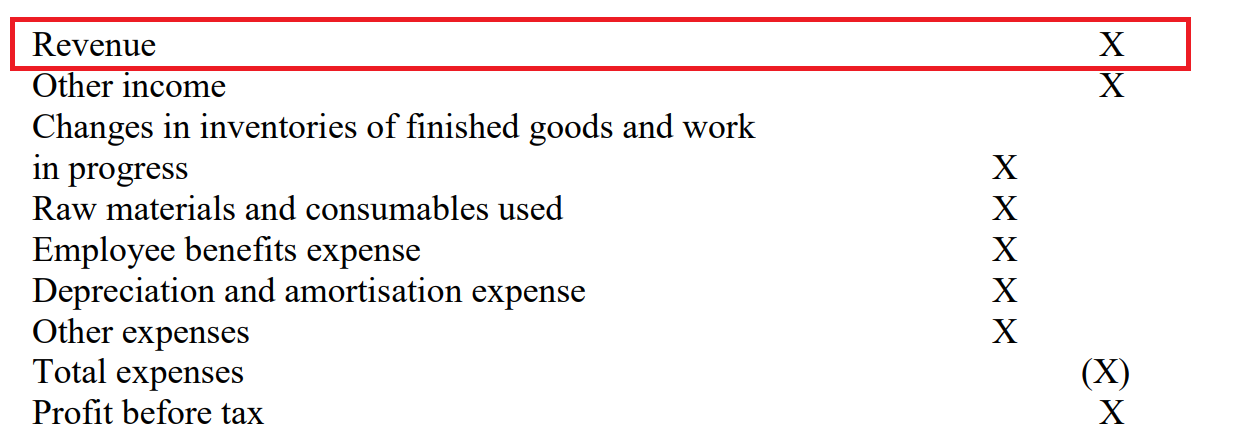
In this format, the top line i.e., revenue shows the top line growth variable of the company.
Whether month-over-month, quarter-over-quarter, or year-over-year, top-line growth shows a company’s effectiveness in generating sales through rising gross sales and/or revenue.
Top-line growth can be impacted by several variables. Considerations such as these encompass market demand, pricing strategies, marketing and sales initiatives, new product introductions, and market growth. As an example, a company can increase its top line by launching new products that meet customer needs and increase market demand and sales.
Top-line growth is crucial to a business. Lots of people take it as a sign that their marketing efforts were fruitful and that their sales team was able to close the deal. An increase in the top line can also help a business get the capital it needs to grow and invest.
Understanding bottom-line growth
Bottom-line growth refers to the increase of a firm’s net income or profit, which is found at the bottom of its financial statements and therefore referred to as bottom-line growth.
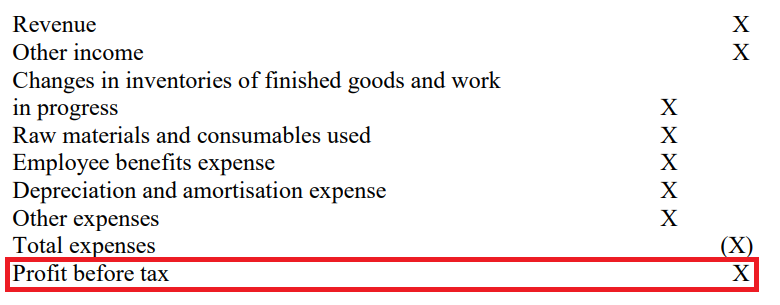
In this format, the bottom line i.e., Profit before tax shows the bottom-line growth variable of the company.
Growth in the bottom line can be impacted by several variables. Tax planning, price strategies, operational efficiency, and cost management are all part of this category. For instance, cutting wasteful spending and increasing operational efficiency are two ways a business can increase its bottom line.
To boost their bottom line, businesses can use a variety of tactics. For instance, a business may increase profits by investing in technology that streamlines operations and reduces expenses.
Increasing the bottom line is a crucial indicator of a company’s profitability and a crucial factor in determining its success. If you want to know how healthy a company’s finances are and where they’re heading strategically, you should learn the pattern of the bottom line growth.
Top-Line vs Bottom-Line Growth: Key Differences & Importance
| Top-line growth | Bottom-line growth | |
| Definition | Represents the increase in a company’s revenue or sales. | Represents the growth in a business’s profit or net income following the deduction of all costs and taxes. |
| Focus | Primarily focuses on revenue generation. | Emphasises profitability after all expenses. |
| Calculation | Calculated by comparing revenue from one period to another. | Calculated by comparing net income from one period to another. |
| Indication | Describes how well the company can make sales and increase its top line. | Describes how well the company is at keeping costs low and making money. |
| Importance for investors | Provides insights into a company’s revenue growth trajectory. | Provides information on the financial well-being and profitability of the business |
Example – Tata Motors
| Particulars | March 2022 (₹Crores.) | March 2023 (₹Crores.) | Growth |
| Sales | 278,454 | 345,967 | 24.25% |
| Expenses | 253,734 | 314,151 | |
| Operating profit | 24,720 | 31,816 | |
| Other Income | 2,424 | 6,328 | |
| Interest | 9,312 | 10,225 | |
| Depreciation | 24,836 | 24,860 | |
| Profit before tax | -7,003 | 3,058 | |
| Tax % | -60% | 23% | |
| Net profit | -11,309 | 2,690 | 123.79% |
The table presents a financial summary of Tata Motors from March 2022 to March 2023. The top line, represented by sales, shows a growth of 24.25%, increasing from ₹278,454 crores in March 2022 to ₹345,967 crores in March 2023. It indicates a successful year in terms of revenue generation, possibly due to increased market demand or effective sales strategies.
On the other hand, the bottom line, represented by net profit, shows a remarkable turnaround. The company went from a net loss of ₹11,309 crores in March 2022 to a net profit of ₹2,690 crores in March 2023, marking a growth of 123.79%. This dramatic improvement could be attributed to effective cost management, operational efficiency, or strategic pricing.
Bottomline
Understanding the difference between top-line and bottom-line growth is crucial for businesses and investors. While top-line growth reflects a company’s revenue generation capabilities, bottom-line growth indicates profitability. The secret to long-term success and expansion for any company is striking a balance between the two.
FAQs
The ‘bottom line’ refers to a company’s net income or profit, which is calculated by subtracting all expenses, including operational costs, interest, and taxes, from its total revenue. For example, if a company has total revenues of ₹600 crores, and the total expenses including operational costs, interest, and taxes amount to ₹400 crores, the ‘bottom line’ or net income would be ₹200 crores.
A top-line strategy is a plan that aims to enhance a company’s gross sales or revenues, often referred to as the ‘top-line’. This strategy focuses on increasing sales by attracting new customers, retaining existing ones, and boosting sales volume. It involves optimising sales, marketing, and customer service efforts. Key elements can include product innovation, market expansion, and effective pricing strategies.
The bottom line is a key indicator of a company’s profitability. It’s important because it shows how much profit a company has made after all expenses, including operational costs, interest, and taxes, have been deducted from its total revenue. By understanding their bottom line, business owners can make better pricing, production, and investment decisions to maximise profitability and avoid losses.
The bottom line growth rate, also known as the net income growth rate, quantifies the rate at which a company’s profitability grows over a given period. It’s usually expressed as a percentage and is calculated by subtracting the previous period’s net income from the current period’s net income and dividing the result by the previous period’s net income. This rate represents a company’s potential to generate sustainable earnings after deducting all expenses.
EBITDA margin is a financial metric that measures a company’s operating profit as a percentage of its revenue. The acronym EBITDA stands for earnings before interest, taxes, depreciation, and amortisation. It’s calculated by dividing EBITDA by total revenue. This ratio provides insights into a company’s operational profitability, excluding non-cash expenses and other factors. It’s particularly useful for comparing the performance of companies within the same industry.