Amongst the top pillars of stock selection is analysing its fundamentals. Often, the first step of analysing an investment opportunity is to conduct fundamental analysis on the security. Fundamental analysis requires a thorough examination of a stock’s intrinsic value rather than assuming its market price at face value.
With advancements in technology, this can now be conducted fairly quickly, accurately, and predictably using stock market AI tools. In this blog, we explore how to do fundamental analysis of stocks using Artificial Intelligence (AI). This will include the use of quantitative measures such as financial statements, ratios, and metrics, along with qualitative factors, including management quality and peer comparison, among others.
How to Do Fundamental Analysis of Stocks?
Fundamental analysis of stocks done by analyzing company’s financial statements, including the income statement, balance sheet, and statement of cash flows. AI tools and software such as Stoxo by Stockgro, India’s first stock market research AI tool, can simplify your fundamental analysis. Using Stoxo, you can conduct a thorough analysis of a stock’s financial statements with AI.
Income Statement: Revenue, Profitability
The first step of fundamental analysis often begins with analysing the financial statements of a company. Key metrics such as revenue and profit indicate the company’s efficiency, comparative profitability, and profit potential.
For example, consider the total revenue figure on the company’s income statement. This can be compared to the revenue of the previous period to understand the growth trajectory. If the revenue has improved, we can further study the revenue components to determine which component has contributed the most. Similarly, other metrics can also be evaluated in this way.
Let us see how Stoxo can help with the fundamental analysis of income statements. Let’s take the example of Infosys. We will evaluate Infosys’s latest available income statement through Stoxo.
Initially, we use a customised prompt to ask the AI tool to analyse the income statement, sharing the link to it.

The result generated by Stoxo:
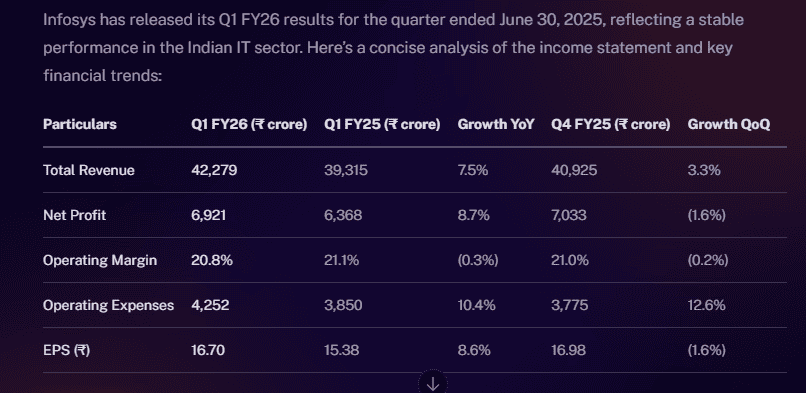
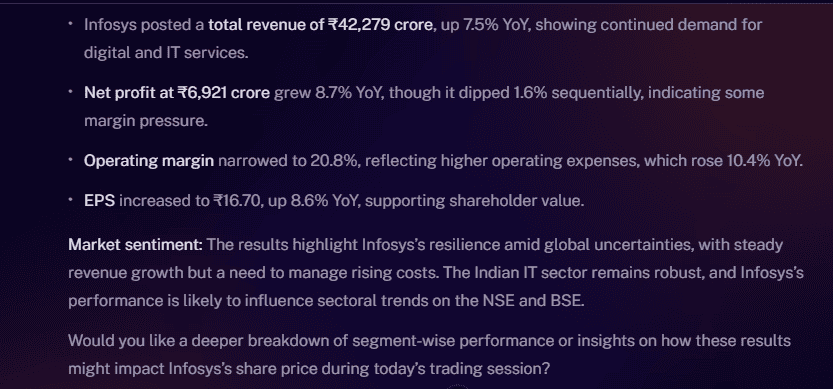
Stoxo has successfully generated insights on Infosys’ income statement. It provides insights into how the revenue and net profits have increased.
Balance Sheet: Assets, Liabilities, Equity
A balance sheet is an official summary that displays a company’s financial position on a particular date. This statement details the value of assets, liabilities, and equities held by the company over time. Analysing this information is crucial in determining the stock’s intrinsic value.
For example, fundamental analysis utilises metrics such as current ratio, leverage ratio, and debt-to-equity ratio, among others, to understand where the company stands. These ratios are crucial as they reveal a company’s financial standing and stability.
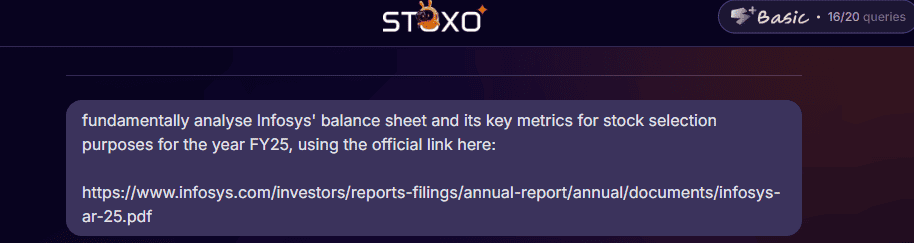
Let’s see how Stoxo would analyse Infosys’ FY25 balance sheet.
Using a customised prompt, ask Stoxo to perform fundamental analysis on Infosys’s FY25 Balance Sheet.
Stoxo then provides insights on key metrics of the balance sheet:
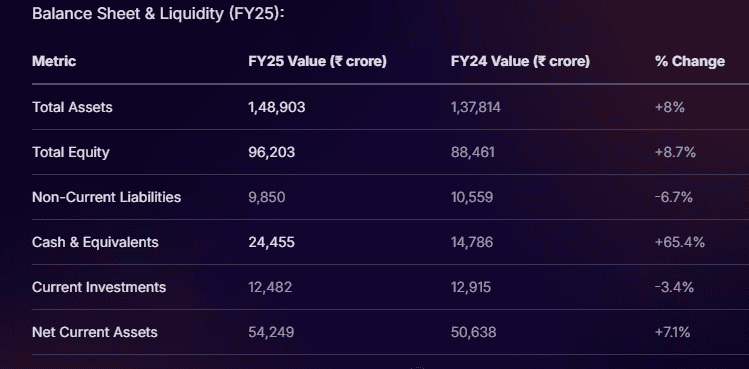
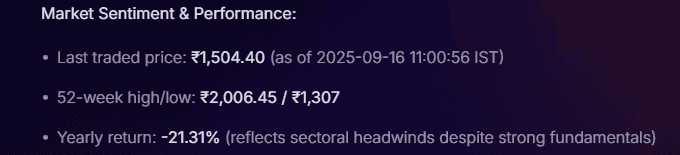
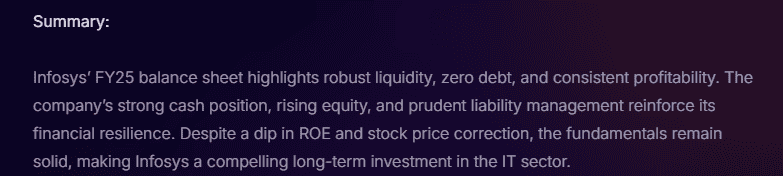
Stoxo presents an insightful summary of how Infosys’ balance sheet displays robust liquidity, zero debt, and consistency in profits.
Cash Flow Statement: Free Cash Flow
Cash flow statements provide detailed insights into a company’s monetary movements in a particular time period. These monetary movements are segregated into operating, investing, and financing activities. For fundamental analysis, investors focus on free cash flow, which is the remaining cash balance after paying for all operating and capital expenditures.
For instance, a positive free cash flow implies that the company can generate a cash surplus after deducting capital expenditures and operational expenses.
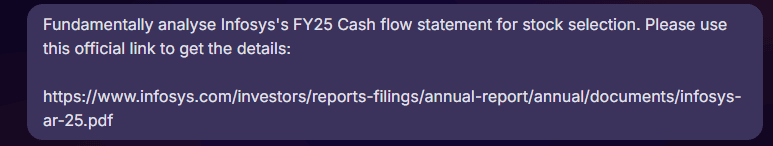
Let’s check out how Stoxo generates a fundamental analysis report for Infosys’ cash flow statements for FY25. After inputting a prompt to conduct a fundamental analysis on the cash flow statements, Stoxo generates the following output:
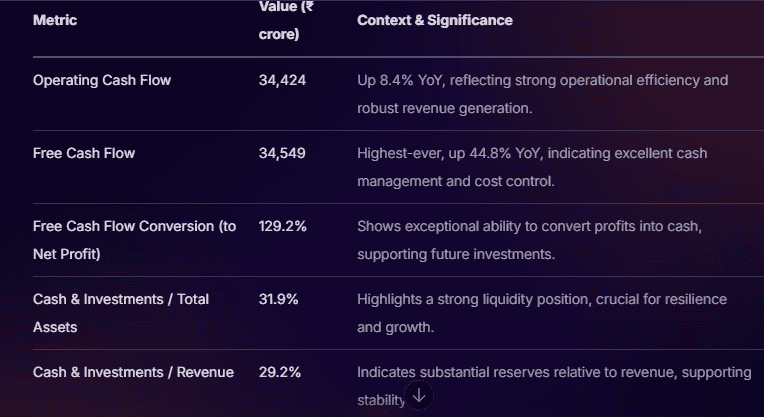

This helps users understand the importance of increasing levels of free cash flow in a company.
Key Financial Ratios & Metrics
Financial ratios and metrics are crucial in determining the company’s comprehensive financial health.
- P/E, P/S, EV/EBITDA
The price-to-earnings ratio is an estimate of investors’ willingness to pay per unit of earnings of the share.
P/E= Price of the share/ Earnings per share
The Price-to-sales ratio illustrates how much investors are willing to pay per unit sales of the company.
P/S= Price of the share/Sales per share
The EV/EBITDA ratio is used to evaluate the company’s overall value in comparison with its earnings.
EV/EBITDA = Enterprise value/ Earnings Before Interest, Taxes, Depreciation & Amortisation
- ROE, Current Ratio, D/E, Profit Margins
- ROE: Return on Equity is used to evaluate how efficiently a company can use its shareholders’ equity to generate returns. It is calculated using the following formula:
ROE = Net Income/ Average Shareholders’ Equity - Current Ratio: The Current ratio measures a company’s short-term liquidity position. It is calculated as:
Current Ratio = Current Assets/ Current Liabilities - D/E Ratio: The Debt-to-Equity Ratio is used to calculate the relative proportion of debt financing vs equity financing. It is calculated as:
D/E= Total Debt/ Shareholders’ Equity - Profit Margins: Profit margins are measured as a percentage of the total revenue to demonstrate the profitability of the company. It can be determined as:
Profit Margin: Net Profit/Revenue
- PEG Ratio (Growth-Adjusted Valuation)
PEG Ratio is the Price/Earnings-to-Growth Ratio, which is used to evaluate the P/E Ratio in comparison to the projected growth rate of the earnings. This figure provides an overall valuation perspective of the company, considering its growth potential. This is calculated as:
PEG Ratio = (P/E Ratio)/ Projected Growth Rate
Generally, a PEG Ratio of more than 1 implies an overvaluation of the stock. A PEG Ratio of less than 1 is considered undervalued.
Now, let’s use Stoxo to summarise and interpret the key ratios and metrics of Infosys for FY25. Inserting a prompt that commands Stoxo in a custom tone generates the results as follows:
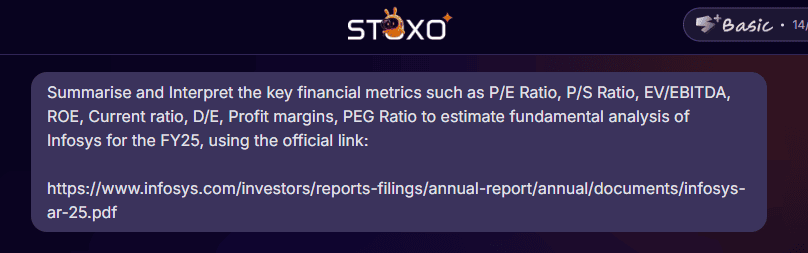
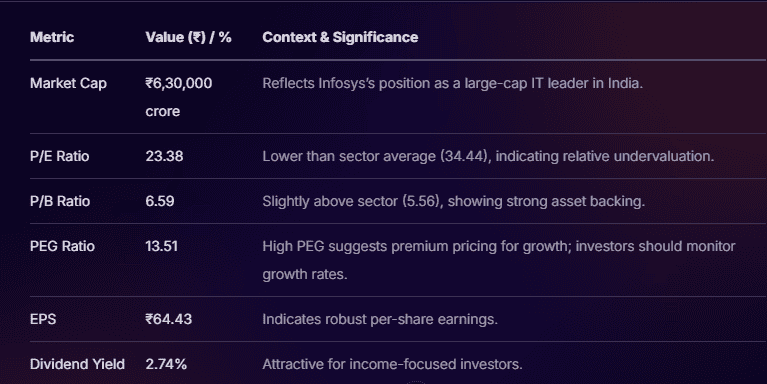
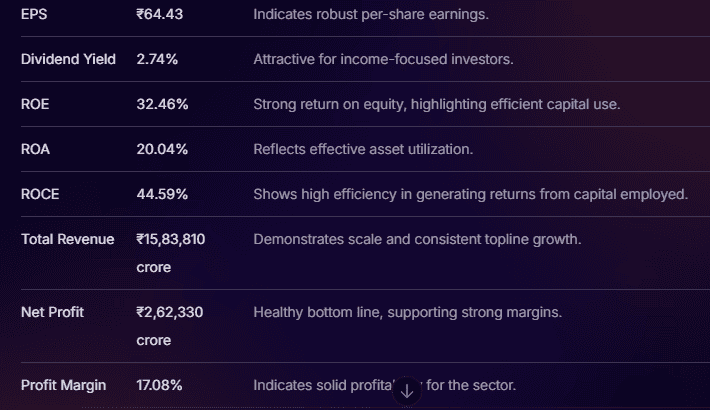
Stoxo generates a list of metrics and the associated interpretation simply. This helps investors understand the logic behind each metric.
Qualitative Analysis for fundamental analysis of stocks
Fundamental analysis does not solely rely on financial metrics. Rather, qualitative analysis is also a part of fundamental analysis. Qualitative analysis examines the stock’s potential by estimating the qualitative aspects of the company. Let’s observe the indicators involved in qualitative fundamental analysis.
- Management Quality & Governance:
Studying qualitative aspects of a stock requires understanding the management quality of the business. The analysis evaluates the quality of leadership, decision-making, corporate governance, and risk management of the company.
Qualitative analysis interprets management’s track record to estimate historical successes and their core areas. It also studies management’s effective communication skills with stakeholders in accordance with governance norms.
- Competitive Moat & Economic Advantage
A company is well-positioned to hold a competitive edge when it employs innovative strategies, often called an ‘economic moat’. Qualitative analysis examines the uniqueness of products or services, brand strength, cost advantages, patents, or customer loyalty that protect the company from competitors. This moat ensures sustainable profitability and shields the business from market disruptions.
- Industry Trends & Economic Indicators
In qualitative analysis, it is also crucial to evaluate the broader industry and macro signals. Qualitative analysis considers demand-supply trends, regulatory environment, technological shifts, and macroeconomic factors, including interest rates, inflation, and GDP growth. These elements help assess how external forces can impact the company’s growth potential and market position.
Let’s see how Stoxo can help with qualitative analysis.

The output generated:
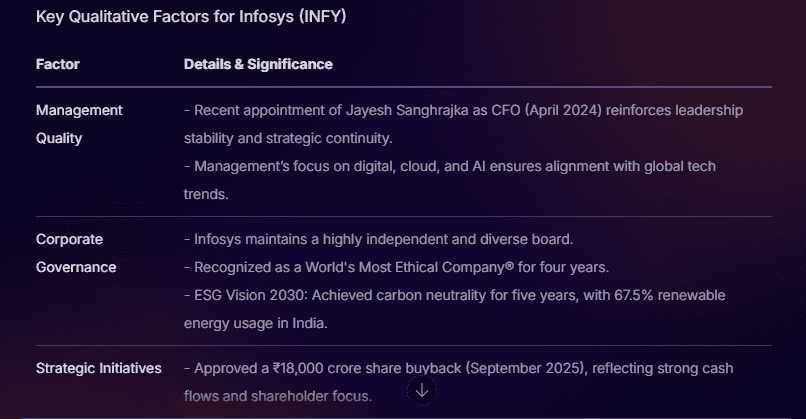
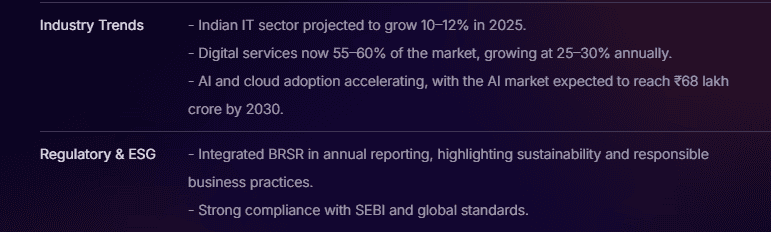
In milliseconds, Stoxo effortlessly generates a quick report on the major qualitative aspects of Infosys. Details on recent management changes, regulatory compliance, and strategic initiatives are all listed in the output. This helps investors get a comprehensive qualitative analysis of the company.
Valuation Techniques for fundamental analysis of stocks
While the above measures guide fundamental analysis, the analysis is incomplete without the use of frameworks used to determine the intrinsic value of the stock. This section introduces the different valuation techniques used in the fundamental analysis of stocks.
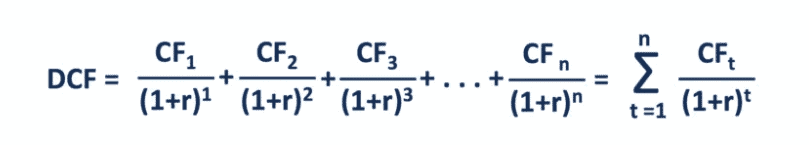
- Discounted Cash Flow (DCF):
A Discounted Cash Flow (DCF) model constructs fundamental analysis by discounting the expected future cash flows to get the intrinsic value today. The discounting rate is the weighted average cost of capital (WACC). DCF is based on the time value of money concept and helps investors estimate whether the stock is undervalued or overvalued.
- Peer Multiple Comparison:
Fundamental analysis establishes a valuable perspective on the company’s fundamentals. Through peer multiple comparison, a company’s valuation multiples (P/E, P/B, EV/EBITDA) are suitably compared against those of similar companies in the same industry. It helps assess relative valuation to identify whether a stock is priced competitively, based on market norms and sector trends.
Let’s see how Stoxo helps in peer comparison.

Upon inserting a custom prompt that mentions the peers to be compared with, Stoxo generates the results below:
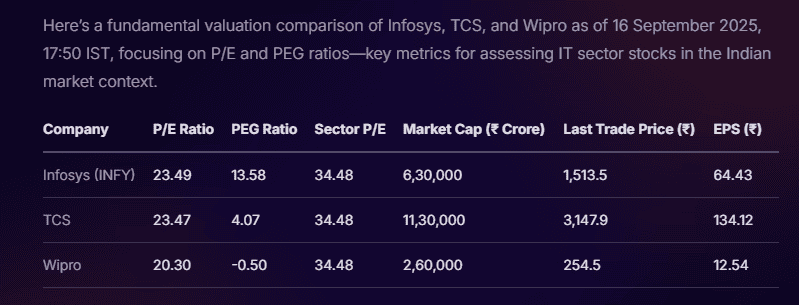
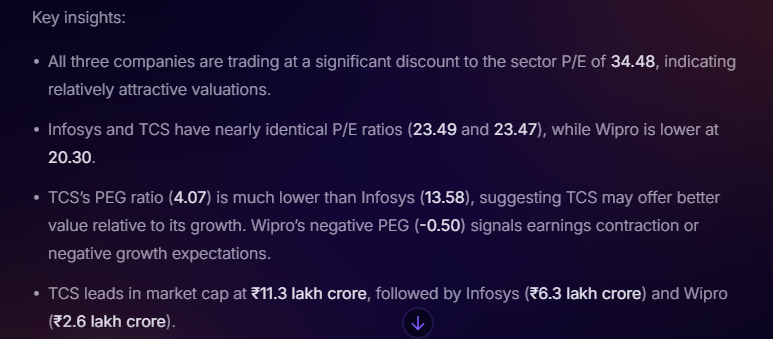
These insights provide users with important information about the stock’s positioning amongst its peers.
Margin of Safety & Value Investing Principles
Value investing focuses on buying stocks that trade below their true worth to build wealth over the long term. Within value investing lies the principle of margin of safety. Margin of safety is the disparity between a stock’s price and its intrinsic value. Investors aim to invest in stocks at a lower price, thereby keeping a safety net. This feature helps in protecting investors from significant losses.
Making Your Investment Decision
Conducting fundamental analysis is now simplified through the use of the Stoxo Platform. One can run all aspects of fundamental analysis, such as analysing financial statements, working through key metrics, examining qualitative aspects, and running data analysis. Ultimately, the decision to invest is yours. Stoxo will help you get specific insights into the stock’s performance and financial position. However, the final investment decision should be taken once you are confident in the output.
For quick and easy investment decisions, try using the Stoxo software for fundamental analysis of your preferred stock.
Conclusion
Investment research begins with fundamental analysis, which includes analysing financial statements, key metrics, qualitative and quantitative aspects of a company. Today, AI tools such as Stoxo are working efficiently to provide investors with the required analysis within seconds. Yet, the decision to invest remains with you!
FAQs
Fundamental analysis of stocks is the analysis of the stock’s fundamentals, including studying the financial position, statements, key metrics, and qualitative analysis. Fundamental analysis is used to gauge the financial health of a stock to determine its worthiness.
A company’s financial statements can be analysed using the income statement, balance sheet, and cash flows. This method involves using measures such as net profits, revenue potential, and free cash flow to assess the company’s financial position.
Financial ratios are important to gain meaningful information on a company using fundamental analysis. Key ratios used in fundamental analysis are: current ratio, price-to-earnings ratio, price-to-sales ratio, PEG ratio, debt-to-equity ratio, etc.
A Discounted Cash Flow method is used to determine a stock’s intrinsic value. The method involves discounting future cash flows to the present value, using the concept of time value of money. A discount rate equal to the weighted average cost of capital is used.
PEG ratio is a commonly used valuation tool to determine the stock’s worth by considering the future growth potential of the company. It is a refinement of the P/E ratio that also factors in the projected growth. It is calculated as:
PEG Ratio = P/E Ratio ÷ growth rate
Margin of safety is the difference between a stock’s intrinsic value and its market price, providing a buffer against errors or market volatility. Buying with a margin of safety helps reduce downside risk, ensuring investments are made below true worth for capital protection.
Qualitative factors like management quality, corporate governance, industry position, and business model influence a company’s long-term success and stability. They complement financial metrics in fundamental analysis by indicating operational strengths and risks not visible in numbers alone.

Leave a Comment