First, the markets move, and then the indicators react! That’s how the price action trading strategy came into effect, which focuses on raw price movement, candlestick patterns, and market structure, rather than depending on technical tools. But what is this price action trading strategy?
In the stock market, it’s reading what the price is doing. This strategy is used to identify trends, breakouts, reversals, and supply and demand zones. This is important for traders because price is the most honest data on a chart.
In this article, we will explore what price action trading strategy is, how to read charts clearly, trending vs consolidating markets, breakout setups, inside bar and pin bar strategies, trend entries after retracements, tools used, and the benefits of price action trading.
What is Price Action Trading?
Price action trading is a trading method that focuses purely on price movements on a chart. It studies how price behaves over time, through candlestick patterns, highs and lows, trends, and breakouts, without depending on technical indicators such as RSI or MACD.
In simple terms, price action in the stock market is reading the raw price movement to understand buyer and seller behaviour. For example, when the price forms higher highs and higher lows, it signals strength, and when it breaks support & resistance levels, it hints at shifts in the momentum.
What is price action in the stock market?
Price action in the stock market refers to the movement of a stock’s price over time, without any filters and overlays, showing just the rise and fall in price that we see on the charts.
This reflects a battle between the buyers and sellers, with every tick on the screen. For example, when buyers dominate, prices rise, and when the sellers take control, prices fall. This constant push and pull creates patterns, such as higher highs, lower lows, breakouts, and consolidations, and this visible structure is price action.
Examples of some of my favourite price action trading strategies:
Theory is useful, but seeing price action on a chart is useful in many ways. Here are a few real-world examples of how a price action trading strategy works in the stock market:
- Breakout trading setup (Bearish breakdown from consolidation):
A bearish breakdown setup involves identifying a tight consolidation zone, such as a triangle, flag, or rectangular channel, where selling pressure builds.
Let’s take a look at the 1-minute chart of Tata Motors Passenger Vehicles on 10 February 2026:
Here, we can see that the stock is moving within a range of ₹379 and ₹380 for a while, and multiple small candles are forming near support, which reflects hesitation and weak buying pressure. The price also started forming slightly lower highs, hinting at growing selling strength.
And, eventually, a strong bearish candle broke below the ₹379 support level with momentum. This breakdown confirmed that sellers had gained control after consolidation. The setup reflects a classic bearish breakout from a range using pure price structure and momentum.
- Trend Reversal x Pullback Entry Strategy:
A trend reversal with pullback entry strategy identifies a structural change in market direction (reversal), then waits for a temporary, counter-trend price correction (pullback) to enter in the new direction at a favourable price.
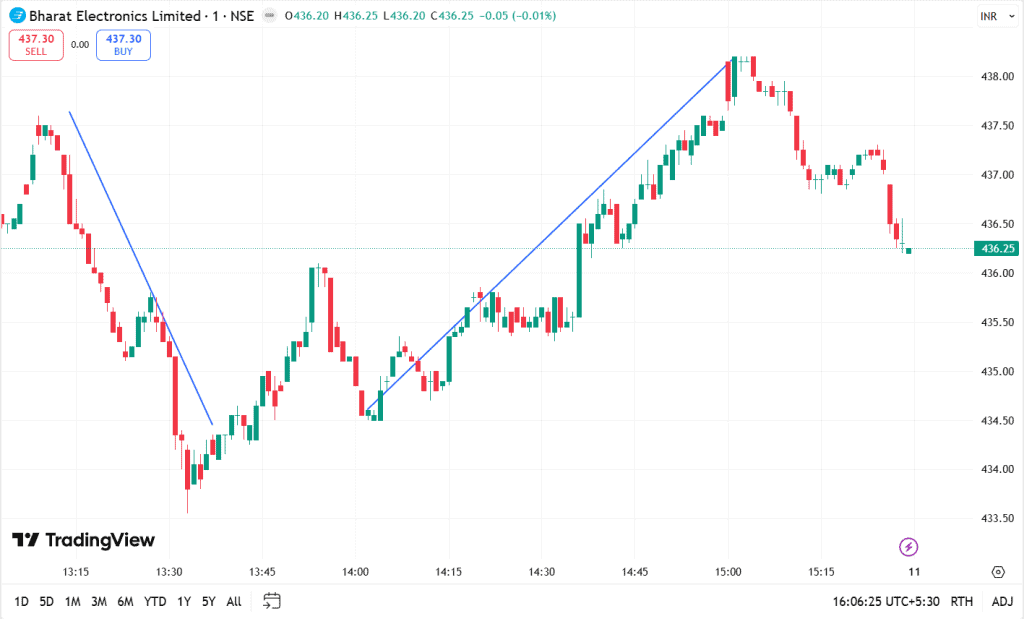
Take a look at the Bharat Electronics Limited (BEL) chart on the 1-minute timeframe, on 10 February 2026:
In this chart, the session begins with a clear downtrend, with price forming lower highs and lower lows, showing strong seller control. This phase reflects bearish momentum, where every small pullback fails to break the previous swing high.
The shift happens when the price stops making new lower lows, and soon after, a strong bullish candle breaks above the previous lower high. This break in structure signals that buyers are stepping in. The earlier bearish control weakens, and the market direction begins to change.
Following the breakout, the price pulls back slightly but holds above the new support level, forming a higher low, and from there, the stock resumes its upward move, creating higher highs and higher lows. This confirms a trend reversal and continuation.
Determine Trending vs Consolidating markets using price action
A trending market shows a clear structure, where in an uptrend, the price forms higher highs and higher lows, and a downtrend forms lower highs and lower lows. The candles usually close strongly in one direction, and pullbacks are shallow. Here, the momentum feels clean and progressive.
A consolidating market, on the other hand, moves sideways, where the price respects horizontal support and resistance levels. The highs and lows appear relatively equal, breakouts usually fail quickly, the candles overlap, and the momentum lacks follow-through. This is where liquidity sweeps and false breakouts are common.
Using price action in these markets means reading these structures early. For example, if the structure is directional, trade with the trend, and if the structure is flat, either trade the range extremes or wait for a confirmed breakout.
The market shifts between trend and consolidation. Therefore, the tactical advantage lies in recognising which phase you’re in before placing the trade.
How to Read Supply and Demand on Price Charts
Prices move due to an imbalance between buying and selling, creating supply and demand zones on a chart.
In price action trading, supply is the area where selling pressure previously pushed the price down sharply. And, demand is where strong buying lifted the price again. For example, if the price leaves a level with large candles and minimal pullback, that zone likely holds institutional activity.
To identify a demand zone, look for a place where the price stopped falling and then rallied with strength. The move away from that level is usually sharp and decisive, which shows that buying pressure outweighed selling pressure. When price later revisits the same area, it may react again because that earlier interest might have left unfinished orders behind.
A supply zone appears when the price pauses and then declines aggressively. The sharp drop signals heavy selling activity. And, if the price climbs back to that level, it may encounter resistance as sellers step in once more.
How to Trade with Price Action Trading Strategies
Trading with a price action trading strategy begins with observation. With price action trading strategies, you study the structure, for example, how the price is forming highs and lows, where it pauses, and where it accelerates.
- Identify market condition: If the price forms higher highs and higher lows, the market is trending upward, and if it forms lower highs and lower lows, the trend is downward. In sideways conditions, price moves between defined support and resistance levels.
- Mark support & resistance levels: These include previous swing highs and lows, support and resistance zones, and areas where price previously moved with strong momentum.
- Wait for confirmation: A breakout candle closing above resistance, a rejection wick at support, or a higher low after a structure break are examples of price action signals.
- Risk management: You must manage risks in whatever you do. Usually, stop-losses are placed at recent swing points, or where the trade idea would logically fail, and targets are set aligned with the next key level on the chart.
Who uses price action trading?
Price action trading is applied across various segments of the stock market because it focuses on the most direct data available: price.
- Day traders: They usually rely on a price action trading strategy to capture short-term movements. On lower timeframes, they can observe breakouts, pullbacks, and momentum shifts without depending on indicators.
- Swing traders: They also use price action to identify structure on daily or hourly charts, to track higher highs, higher lows, and supply or demand zones to understand directional moves.
- Institutional players: They monitor the price structure, as price levels, liquidity zones, and market structure remain central to their decision-making.
Best Price Action Trading Strategies
The following are the best price action trading strategies:
Trend trading
As the name suggests, this strategy denotes the study of price trends. There are varied trading techniques to spot and follow price action trends.
Using predefined methods like head and shoulder trade reversals can help you determine the uptrend or downtrend. You can simply take the long position for the uptrend and short the asset for a downtrend.
Inside bar
The inside bar pattern refers to a two-bar strategy, where the inner bar lies under the high and low range of the outer bar.
In simple words, traders can use this trading strategy to identify the entry and exit points and consolidation in the market. Moreover, the inner bar’s size and position determine the uptrend or downtrend.
Pin bar
The pin bar strategy, popularly known as the candlestick strategy, demonstrates the sharp reversals and rejection of the specified asset. Its wick or tail showcases the range of prices that got rejected.
According to this strategy, the price continues to move in the opposite direction of the tail. It can allow the traders to take a short or long position in the market.
Trend after a retracement entry
In a trend after a retracement entry strategy, traders are required to follow only the existing trend. If the market is experiencing a downturn, you have to short the asset.
Similarly, if the market is experiencing an uptrend, you may consider taking a long position.
Trend after a breakout entry
The trend after a breakout entry strategy works upon a basic assumption that a retracement will follow a price spike. When the market moves out of the desired support and resistance line, it is a clear signal of a breakout.
Here, traders can use it as a signal to take a long position if the market is in an uptrend or breaks the resistance line. Similarly, traders will take a short position if the market goes below the support line.
Sequences of high and lows
You have to follow the sequence of highs and lows strategy to understand the emerging trends in the market. Simply put, a price trading at higher highs and higher lows clearly indicates an upward trend.
If it is trading at lower highs and lows, it will be a downward trend. Hence, a trader can easily use this trend to opt for the entry point at the lower end of an upward trend. Moreover, you can also set up the stop loss, right before the previous higher low.
Different tools used for price action trading
Price action trading doesn’t rely on complicated indicators. Its tools are simple, and visual, which are rooted in how price behaves on a chart.
Breakout
A breakout is one of the key tools in a price action trading strategy. It occurs when the price moves beyond a defined support or resistance level with strength, suggesting that either side of the market has gained control.
Candlestick chart
The candlestick chart is the visual framework used in price action trading, where each candle represents the open, high, low, and close of a specific time period. The shape and size of candles reveal market sentiment, with long bodies indicating strength, and long wicks suggesting rejection.
Trends
Trends provide the structural backbone of any price action trading strategy. An uptrend is defined by higher highs and higher lows, while a downtrend forms lower highs and lower lows. Understanding whether the market is trending or consolidating determines how breakouts, pullbacks, and continuation moves are interpreted.
Benefits of price action trading
- Simplicity: Price action trading relies on raw price movement rather than multiple indicators, which keeps the charts clean and analysis straightforward.
- Clarity of market structure: By focusing on highs, lows, and demand and supply levels, you can clearly identify trends, reversals, and consolidation phases.
- Adaptability across timeframes: The approach can be applied to intraday, swing, and long-term trading, as it is based on fundamental price behaviour in the stock market.
Conclusion
A price action trading strategy is built on understanding how the price behaves across different market phases. By studying trends, breakouts, structure shifts, and supply and demand zones, traders gain clarity without relying on complex indicators. Whether in trending or consolidating markets, price action offers a structured framework to interpret movement, manage risk, and respond to what the chart reveals in real time.