Technical analysis is used to identify breakout patterns and strategies in different market phases. While trading in an uptrend is easy and most people can do it, trading in a downtrend is significantly challenging. One such pattern that holds significant importance in the downtrend is the descending triangle pattern. It is essentially the opposite of the ascending triangle pattern.
What is Descending Triangle Pattern?
The descending triangle pattern is a bearish chart pattern where the price moves in lower high peaks and resists falling below a horizontal resistance. It is a continuation pattern that signals a fall in the price. This formation reflects a tussle between buyers and sellers, with sellers gaining, causing the prices to break down. If the price breaks below the resistance, the traders who shorted the security are likely to win.
Descending triangles are created when sellers drive the price lower, but buyers intervene to hold the price at a particular level. Notice that as time progresses and sellers continue to take over the market, the series of lower highs show us that the bearish momentum is building.
A horizontal support level acts as a key price, when breached the asset can see a sudden decline. This breakout is closely monitored by traders and investors as an indication to take a short entry in the belief that further downside momentum will be seen.
The volume also plays a crucial role in confirming the descending triangle pattern. During the formation of the pattern, trading volume typically decreases, reflecting a reduction in market activity as traders wait for a breakout. After the price clearly breaks through support, we then frequently see a large volume spike in conjunction with this break to confirm the bearish bias.
Traders rely on this surge in volume to confirm that the pattern has played out, leading to more confidence in the downtrend. Traders can use their knowledge of the descending triangle pattern to help them find shorting opportunities in a down trending market.
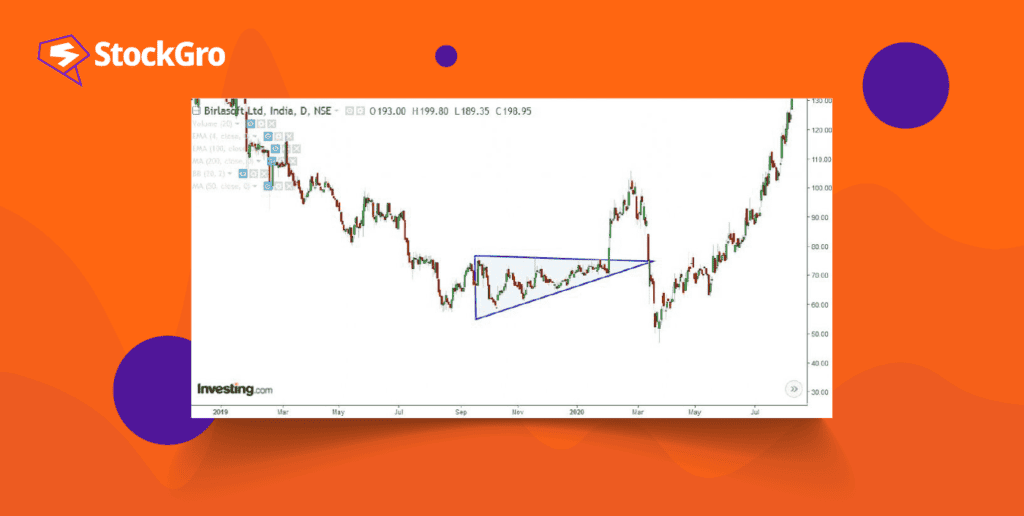
You may also like: What do these symmetrical triangle patterns suggest?
Understanding a descending triangle pattern
Existing continuous trend
To confirm the continuation pattern, there has to be an established downtrend. The strength of the trend is more critical than its duration, given the bearish nature of the descending triangle.
Lower horizontal line
The pattern’s lower part comprises at least two lows to form a horizontal line. It is okay if they are not too close. In that case, the trader can build a resistance level for the prices.
The upper descending trend line
The upper portion of the pattern shows at least two successive highs forming a falling trend line. These reaction highs should decrease, with some separation between them. The triangle pattern is invalidated if a more recent high equals or surpasses the previous one.
Pattern duration
Descending triangles can develop over various timeframes. It starts from a few weeks to several months. These patterns last one to three months.
The descending triangle pattern can emerge within an established uptrend in a bullish market showing strength and the likelihood of the uptrend continuing. However, traders should be able to recognise that this pattern of descending triangle pattern in an uptrend can yield false signals, offering no guarantees of trend continuation.
To determine a potential price target for a descending triangle pattern you can measure the vertical distance from the triangle’s peak to the horizontal support, typically represented as a percentage.
If this distance amounts to 10%, then the logical price target following a breakout would be 10% above the breakout point. This calculation involves adding the pattern’s height to the breakout level, providing traders with a reliable estimate of where prices might move once a successful breakout occurs. To manage risks effectively, it’s vital to accompany this strategy with a well-placed stop-loss order, typically positioned just below the breakout zone.
Also read: Understanding the ascending triangle pattern in technical analysis
How to trade a descending triangle pattern?
Identify the pattern
Start by identifying the descending triangle pattern on a price chart. Look for two or more falling peaks forming a descending trendline and two or more comparable lows forming a horizontal support line.
Entry point
Enter a sell position when the price breaks down below the straight support line. This breakout shows a continuation of the downward trend. To confirm the descending triangle pattern breakout, watch for a decisive price move below the support line, preferably with increased trading volume.
Stop-loss order
Manage your risks by using a stop-loss order. Place the stop-loss slightly above the straight support line with a buffer. It acts as a critical resistance level after the breakout. If the price reverses and rises above this level, it means that the breakout has failed and this is where the stop-loss helps to limit potential losses.
Price target or exit
Determine a price target for your trade. Measure the widest part of the falling triangle which is the vertical difference from the highest high and the straight support line. Subtract this from the breakout point to estimate a potential price target for the downward move.
Also read: Triangle chart patterns: A smarter way to technical analysis
Pros and cons of a descending triangle
Pros:
- Clear Entry and Exit Points: The descending triangle provides clear levels for entering trades (below the lower trendline) and setting stop-loss orders (above the upper trendline).
- Trend Continuation Indicator: This can indicate continuation in a bearish trend, allowing traders to capitalize on a downward move.
- Volume Confirmation: Frequently, volume decreases as the pattern develops, offering traders strong confirmation of the prevailing trend.
- Predictability: Since the pattern is widely recognized, many traders act on it, potentially leading to self-fulfilling prophecies as others react to the same signals.
- Market Psychology: The pattern reflects market psychology, with sellers consistently pushing prices lower, indicating stronger selling pressure.
Cons:
- False Breakouts: There is always the possibility for false breakouts to happen, where the price breaks out from above the pattern without a sustained upward movement, leading to potential losses.
- Delayed Confirmation: Confirmation of the pattern’s validity can come late, meaning traders might miss early profit opportunities if waiting for a clear signal.
- Limited Upside Potential: Trading based on a descending triangle primarily focuses on downward movements, limiting profit opportunities in bullish markets.
- Market Context Matters: The effectiveness of this pattern can depend on broader market conditions, making it less reliable in volatile or sideways markets.
Requires Technical Analysis Skill: Traders need a solid understanding of technical analysis to effectively identify and trade the pattern, which can be challenging for beginners.
Conclusion
Descending triangle chart patterns can be easily identified on price charts and provide a target level based on the triangle’s maximum height. However, there is a risk of a false breakdown, where the expected downtrend reversal does not occur as anticipated. Learn to identify and interpret share market chart patterns and how technical chart patterns can signal profitable trading opportunities.
Prices can also defy the typical characteristics of descending triangles by moving sideways or even higher for extended periods. In such cases, traders may need to adjust their trendlines if prices break out in the opposite direction of their initial expectations.
FAQ’s
A descending triangle is generally considered a bearish pattern. It forms when price creates lower highs while finding support at a horizontal level. This structure shows increasing selling pressure. If the price breaks below the support level, it often signals continuation of the downtrend. However, in rare cases, a breakout above the descending trendline can turn the pattern bullish.
A descending triangle breakout occurs when the price moves decisively outside the triangle formation. A breakdown below support is the most common and signals potential further decline. A breakout above resistance is less common but indicates a possible trend reversal. Traders usually confirm the breakout with increased volume before entering a position.