For decades, investors, experts, and speculators have relied on technical analysis. Technical analysis employs triangles as chart patterns, which are a vital tool for speculating about future market moves and trading possibilities. These patterns get their name from the triangle shape in which they appear and connect the upper and lower trendlines.
But before we jump into the depths of the triangle chart patterns in stocks, their types, and their differences, let’s take a brief look at what technical analysis is.
What is a technical analysis?
Technical analysis is a kind of trading approach in which traders examine markets and forecast future moves based on historical data. Rather than focusing on company performance, this trading approach evaluates past data, such as asset prices and trade volumes, using strategies and instruments. Triangles and candlesticks are among the charts and graphs that are employed as tools in technical analysis.
What is a triangle pattern?
In the stock market, triangle chart patterns are continuation patterns that can be defined as horizontal patterns in trading. The triangle is the widest when it first forms. The triangle’s tip emerges while the market keeps moving sideways, and the trading range gets smaller.
Triangle formations are often seen on charts by traders when an asset’s price narrows its trading range following an uptrend or a downtrend. Triangle formations on charts can predict either a reversal or an extension of the preceding trend, unlike other patterns that provide a definite directionality for the upcoming price shift. Traders must patiently wait for a triangle breakout before reacting to this chart pattern, even though triangles more often indicate a continuation of the preceding trend.
Explaining triangle patterns in technical analysis
Triangle chart patterns are a part of technical analysis, a trading approach where traders analyse charts and patterns to discover market movements and forecast their potential. Triangular patterns get their name because the upper and lower trendlines eventually come together to form an angle at the right side’s apex. These patterns appear when a stock’s or another security’s trading range gets smaller.
The remaining two angles of the triangle are completed by joining the starting point of the lower trendline with the start of the top trendline. The upper trendline is created by joining the highs, and the lower trendline is created by connecting the lows.
Triangles are comparable to other technical analysis tools, including pennants, recurrent patterns created when an asset displays significant activity, and wedges, price patterns identified by parallel trendlines. If proven correct, they can be a powerful reversal or continuation pattern. Traders use triangles to indicate when a stock or security’s trading range narrows following a rising trend or downturn.
As price activity shapes a holding pattern, three possible triangle variations can emerge—ascending, descending, and symmetrical triangles—can emerge. When a triangular pattern breaks, especially on high volume, technicians interpret these events as strong indications of either a continuation or reversal of the previous trend.
Different types of triangle chart patterns
Triangles come in three varieties, and it is important to examine each one thoroughly. These structures are the symmetrical triangle, the descending triangle, and the ascending triangle.
Ascending triangle pattern
A set of two trendlines, one rising and the other horizontal and combining a sequence of higher lows, make up an ascending triangle.
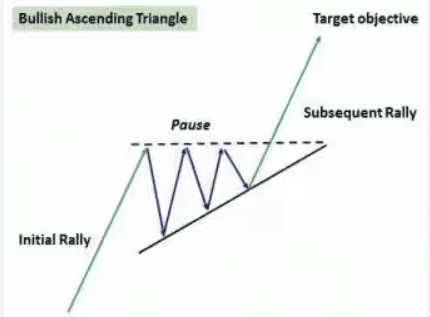
The bullish chart pattern indicates that buyers are getting more aggressive, while the resistance line establishes a threshold that the price finds it difficult to break around. Because of this, the ascending triangle indicates a stage of stability before a possible upward triangle pattern breakout.
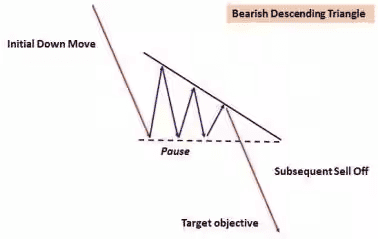
Descending triangle pattern
When the value of investment makes a string of lower highs yet finds support around a horizontal trendline, a descending triangle is created. This bearish chart pattern results in the formation of a downward-slanted triangle. The horizontal lower trendline represents a level of support that has been tested numerous times, while the downward-sloping higher trendline serves as a level of resistance. This pattern points to a probable breakdown and indicates that sellers are becoming more in command of the market.
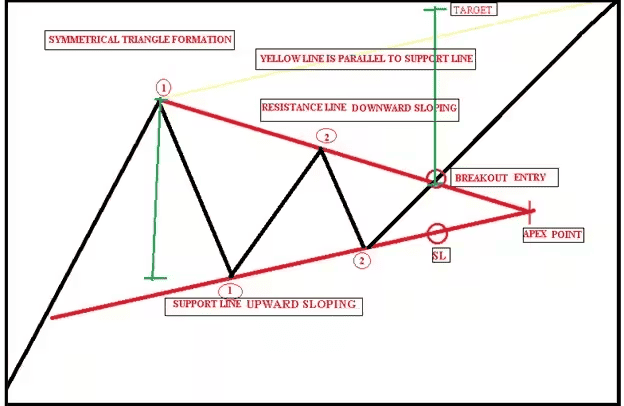
Symmetrical patterns
Thus far, we have observed two triangular patterns: one originating from an upward trend and bullish market movement, and another from a downward trend that has a distinctly bearish appearance. Conversely, symmetrical patterns are seen as recurrent trends that emerge in markets that are largely directionless. The market appears indifferent to it. As a result, it appears that supply and demand are the same.
Ascending and descending triangles: connections and distinctions
There are a number of parallels and distinctions between descending and ascending triangles to take into account. Both patterns, which are made up of successive higher lows or lower highs, are referred to as continuation patterns. They may also point to possible price fluctuation breakthroughs.
But these patterns also differ from one another. Triangles that are ascending have a flat resistance level, and triangles that are falling have a flat support level. Furthermore, ascending triangles generally indicate a bullish sentiment and descending triangles indicate a bearish sentiment. In general, to make wise trading selections, traders should closely examine the similarities as well as the distinctions between these two patterns.
How to Trade Triangle Patterns
Triangle patterns are one of the most popular chart patterns in technical analysis, helping traders identify potential price breakouts. Here is how you can trade triangle patterns:
- Identify the Triangle: Look for the converging trendlines on the price chart. In an ascending triangle, the upper trendline is horizontal, and the lower trendline slopes upward. In a descending triangle, the upper trendline slopes downward, while the lower one is horizontal. A symmetrical triangle has both trendlines converging at an angle.
- Wait for a Breakout: The key to trading triangles is waiting for a breakout. This occurs when the price breaks above the upper trendline (for ascending triangles) or below the lower trendline (for descending triangles). A breakout usually indicates a continuation of the trend, so it’s crucial to confirm it with increased trading volume.
- Enter the Trade: Once the breakout is confirmed, you can enter the trade. For an ascending triangle, consider buying; for a descending triangle, you might sell or short the asset.
- Set Stop-Loss Orders: It’s essential to protect your capital. Place a stop-loss order just below the breakout point for a buy trade or above it for a sell trade. This way, you limit potential losses if the price reverses.
- Set Profit Targets: A common method to set profit targets is to measure the height of the triangle at its widest point and project that distance from the breakout point.
Also, combine these patterns with other indicators for a well-rounded trading strategy. Now, let us shed a light on trading ascending triangle chart patterns.
How to Trade Ascending Triangle Chart Pattern
Here’s a simple way for traders to handle a stock that’s forming an ascending triangle pattern:
Step 1: Spot the Pattern
Look for a stock that has been rising but is now moving sideways. You should see a flat line at the top (the resistance level) and a line going up along the bottom (the support line).
Step 2: Wait for the Breakout
Ascending triangle patterns can take a while to form, sometimes weeks or months. Each time the stock tests the resistance level, there’s a chance it could break out. However, be careful of false breakouts. A real breakout usually happens with higher-than-average trading volume. The closer the upward line gets to the flat resistance line, the more likely it is that a breakout will happen.
Step 3: Enter the Trade
Once the breakout is confirmed, it’s time to enter a bullish trade (betting the stock will go up).
Step 4: Exit the Trade
To find out how much the stock might rise after the breakout, measure the height of the triangle from the lowest point at the start to the resistance level at the top. Add that height to the resistance level to set your profit target.
For your stop loss, set it just below the resistance line. Sometimes, stocks will dip below this line after the breakout, testing it as a support line. If the stock drops significantly below this line, it may indicate that the breakout has failed.
For example, If a stock’s price reaches ₹200 twice and creates a resistance line, but the lows are rising from ₹150 to ₹170, an ascending triangle is forming. A breakout above ₹200 with high volume indicates an upward trend, and you can set your stop-loss below ₹170.
This pattern offers traders a clear strategy to enter, exit, and manage risk effectively during bullish markets.
Conclusion
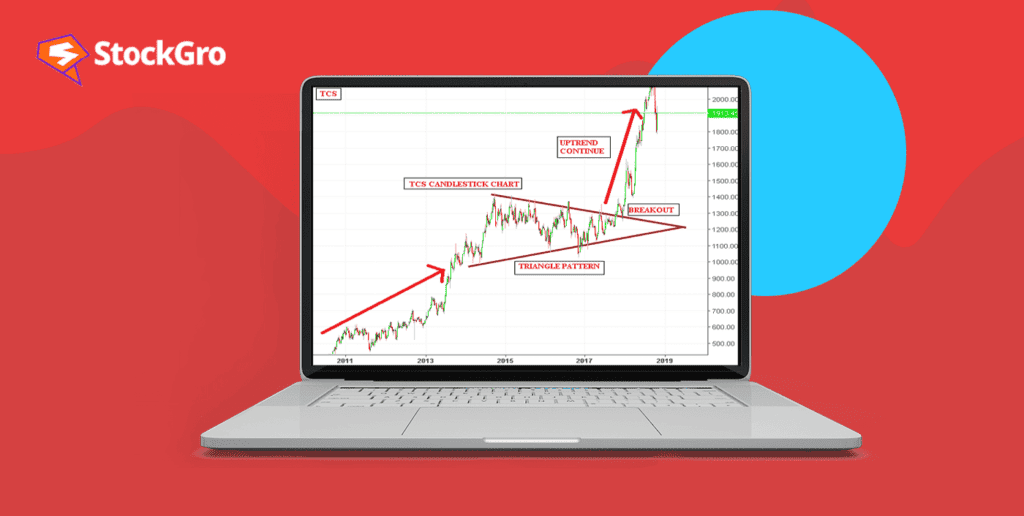
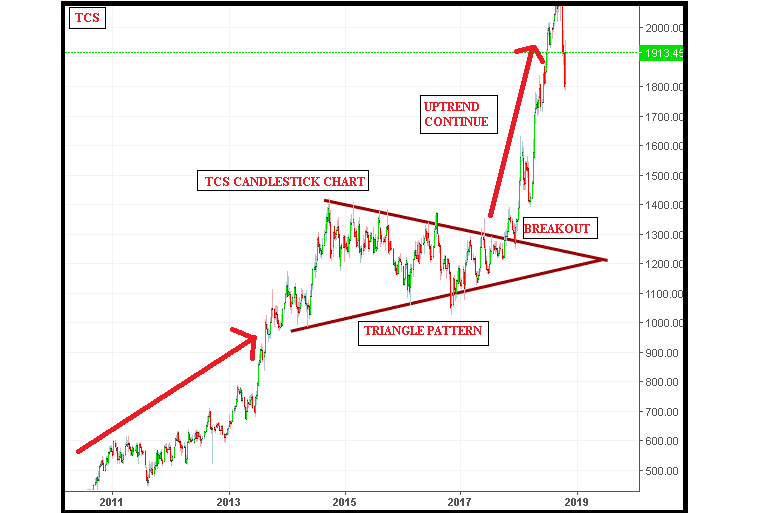
One of the most important duties of any share market analyst is to recognise patterns, and the two major charts are triangle patterns and candlestick patterns. Triangle candlestick patterns combine data from several periods into an individual price bar. On the other hand, the fundamental elements of technical analysis are chart patterns. They are quite easy to identify and recur throughout the market period. Learn to identify and interpret share market chart patterns and how technical chart patterns can signal profitable trading opportunities.
The bottom line is that, technical analysis calls for a significant degree of patience and discipline as with any trading instrument utilised in this method.
FAQ’s
The price target for an ascending triangle is usually calculated by measuring the height of the triangle (distance between support and resistance) and adding it to the breakout level. For example, if the triangle height is ₹20 and the breakout happens at ₹100, the projected target is ₹120.
The main types of triangle patterns in technical analysis are:
Ascending Triangle (bullish bias)
Descending Triangle (bearish bias)
Symmetrical Triangle (neutral, breakout-dependent)
Each pattern reflects a period of consolidation before a potential breakout.
A flat top triangle, also known as an ascending triangle, forms when price creates higher lows while facing resistance at the same horizontal level. It signals increasing buying pressure.
A bullish triangle pattern typically refers to an ascending triangle. It suggests that buyers are gradually gaining control, and a breakout above resistance may lead to further upside.
A triangle breakout occurs when price moves decisively outside the triangle boundary with strong volume. The direction of the breakout often determines the next trend move.
A bearish triangle pattern usually refers to a descending triangle. It forms when price creates lower highs with horizontal support. A breakdown below support often signals further downside movement.