
Benchmark indices NSE Nifty 50 and BSE Sensex took a bit of a tumble, sinking over 1% in Wednesday’s session. The NSE Nifty 50 plunged 207 points or 1.05%, landing at 19,526.55.
Nifty slipped below its consolidation zone, signalling a bearish mood. It even dropped below the 21EMA. The RSI is backing the bearish momentum. On the downside, we see support at 19500, and if it falls decisively below that, brace for more negativity. Meanwhile, resistance is playing hard to get at 19600.
But what does it all mean? Let’s dig deeper into the world of stock market lingo, where we’ll demystify two key terms: consolidation and breakouts.
And here’s the kicker: once you’ve mastered these concepts, they can become your secret weapons for profitable investments. But we’ll get to that later. For now, let’s start with consolidation.
You may also like: Dividend Reinvestment Plans (DRIPs) for long-term wealth creation!
What is consolidation?
Consolidation is like a well-deserved rest after a long run. After a significant price movement, stocks often need a breather. They take a pause, reflecting a period of indecision in the market, which we call consolidation.
In layman’s terms, consolidation is when a stock’s price moves within a defined range for a period of time. With the stock’s price bouncing back and forth between two price levels.
Consolidation comes in different shapes! It could be a simple horizontal sideways range, or it could take the form of a triangle: Symmetrical, Ascending, or Descending.
Symmetrical Triangle: The price moves within the trend line, and the breakout happens when the two lines converge.
Ascending Triangle: The price forms highs around the same level, while the lows create “lower lows” before breaking out.
Descending Triangle: This pattern is all about a breakdown, where the lows formed around the same levels are finally broken.
Identifying consolidation on charts
When it comes to identifying consolidation on charts, it’s all about spotting the calm amidst the storm. Here’s how you can do it:
- Spot the Sideways: Look for periods where the stock price moves sideways, not making any significant upward or downward moves.
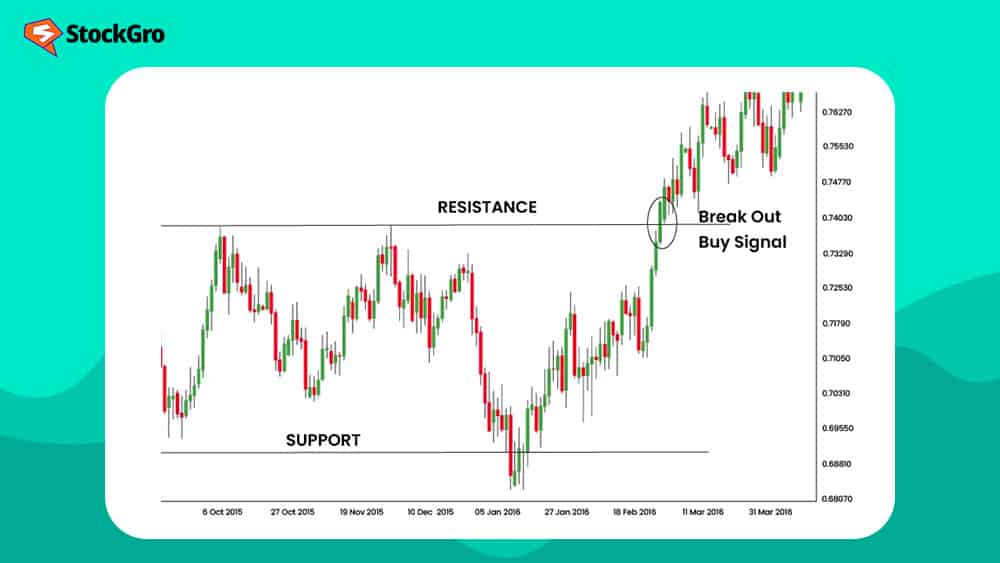
- Find the Range: Identify the high and low points between which the stock price is bouncing. These points form the ‘resistance’ and ‘support’ levels.
- Check the Volume: Often, trading volume decreases during consolidation. It’s like the stock market is taking a nap, and trading activity is on snooze.
So, the next time you see a stock price moving sideways, don’t be quick to dismiss it as boring. It could be the calm before the storm, the consolidation before the breakout.
Short-term Consolidation: This typically lasts for a few days to a few weeks.
Long-term Consolidation: This can last for several months or even years.
Also Read: Demystifying offer for sale (OFS): A wild ride for share prices!
Why does consolidation occur?
Market Psychology Behind Consolidation
Tug-of-War: Consolidation is like a tug-of-war between buyers and sellers. It occurs when neither party has enough strength to pull the stock price in their direction.
Market Participants: Different market participants (retail investors, institutional investors, traders) have different strategies and time horizons, which can shape consolidation patterns.
Impact of Fundamental Factors
Economic indicators like GDP growth, inflation rates, and employment data can influence market sentiment and lead to consolidation. Similarly, company-specific news like earnings reports and corporate announcements can trigger consolidation.
For example, if a company announces better-than-expected earnings, the stock price might spike initially. But if investors are unsure about the company’s future prospects, the price might start to consolidate as they weigh their options.
We talked about consolidation, which leads to breakouts in future. But what does breakout mean? Let’s understand!
What does breakout mean?
In trading terms, a breakout occurs when the price moves above the resistance level or below the support level with increased volume. It’s a significant event because it indicates a potential new trend.
Types of breakouts
Breakouts are like a double-edged sword. They can lead to an upward price movement (bullish breakout) or a downward price movement (bearish breakout). The key is to identify them correctly and act swiftly.
When a breakout occurs, it often leads to a significant price movement. This is the momentum one wants to ride. But, timing is everything. Enter too early, and one might get caught in a false breakout. Enter too late, and you might miss the wave.
False breakouts are like mirages in the desert. They appear to be real breakouts, but they quickly reverse direction. To avoid this trap, look for confirmation through increased volume or a close above/below the breakout level.
Analysing volume trends can provide insights into the validity of a breakout. An increase in volume often accompanies a confirmed breakout, while a false breakout might not see a significant change in volume.
Also Read: Tata Motors DVR Delisting: All you need to know about DVR shares
Breakout vs. 52-Week High/Low
Breakouts can take you to a new 52-week high or low, but not all of those highs and lows are due to breakouts. A 52-week high or low is just the highest or lowest price seen in a year. On the other hand, a breakout means the stock is boldly moving above or below the resistance.
Bottom line
When stocks show a consolidation pattern, get ready for the ultimate breakout moment! Wait for the stock to hold those support or resistance levels with decent volumes. That’s when the real action begins, and the stock rises like a star or falls like a stone.