Summary
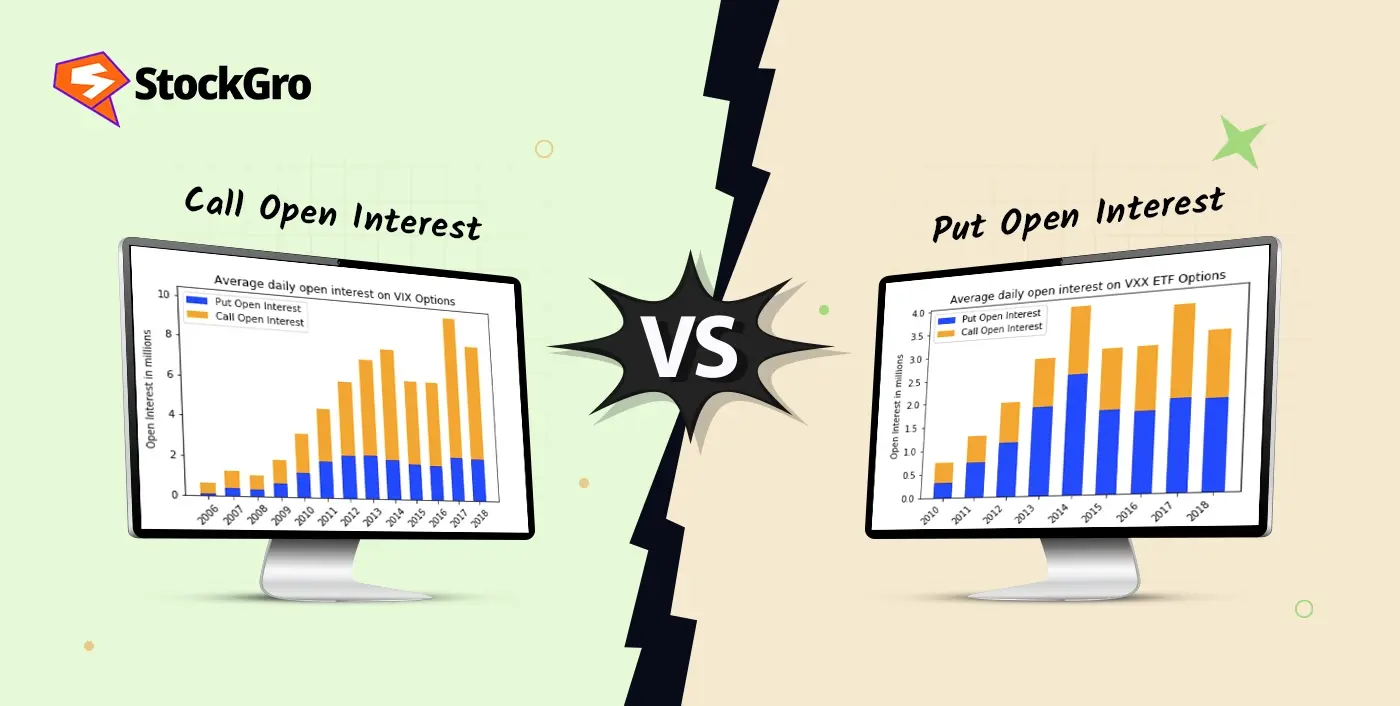
Call open interest represents the number of outstanding call option contracts, while put open interest tracks outstanding put contracts.
Analyzing the ratio between call and put open interest helps gauge market sentiment.
Traders use this data to anticipate support-resistance levels and potential price movements.
What is Call Open Interest?
Call open interest is the total number of call option contracts that are currently active meaning they’ve been opened but not yet closed, exercised, or expired. Every time a buyer purchases a call and a seller writes that contract, one new unit of open interest gets created. When either party closes their position, it goes down by one.
Why does this matter? Because the strikes where call OI piles up tend to act as resistance levels. Think about it this way, if 15 lakh call contracts are sitting at the Nifty 24,000 strike, that means a huge number of people have sold (written) calls at that level. Those sellers profit if Nifty stays below 24,000. So they have a financial incentive to defend that level. They’ll hedge, they’ll adjust positions, and the cumulative effect of all that activity creates a ceiling that the market often struggles to break through. It’s not magic. It’s just a lot of money sitting on one side of a bet.
What is Put Open Interest?
Put open interest works the same way just in the opposite direction. It counts the total active put contracts that haven’t been closed or expired yet. A new put contract is born when someone buys a put and someone else writes it. When either side exits, OI drops. If you want a refresher on how puts work before we go further, put options covers the foundations.
High put OI at a specific strike tends to act as a support level. Here’s why. The people who sold those puts collect premium as long as the price stays above that strike. They don’t want the market to fall below it so they’ll actively hedge to protect their position. When 12 lakh put contracts pile up at Nifty 23,500, that’s a wall of money betting that the index won’t drop below that level. It doesn’t make the level unbreakable, but it does mean there’s real financial muscle working to keep it intact. Support and resistance on a chart become much more meaningful once you see the OI numbers backing them up.
Call vs Put Open Interest
| Feature | Call Open Interest | Put Open Interest |
| What it represents | Active call contracts not yet closed | Active put contracts not yet closed |
| Market implication when high | Resistance sellers defend that strike from above | Support sellers defend that strike from below |
| Rising OI + rising price | Fresh call buying bullish conviction entering | Put sellers gaining confidence also bullish |
| Rising OI + falling price | Call sellers adding positions bearish pressure | Fresh put buying bearish conviction entering |
| Falling OI | Positions being unwound conviction fading on that strike | Positions being unwound support at that strike weakening |
| Where to look | Strikes above the current price | Strikes below the current price |
| Key ratio | PCR = Put OI ÷ Call OI (above 1 = bullish sentiment, below 1 = bearish) | Same ratio, just read from the put side |
The put-call ratio (PCR) deserves a quick note because you’ll see it everywhere. Divide total put OI by total call OI. A PCR above 1 means more puts are active than calls which, counterintuitively, is often considered bullish. Why? Because heavy put writing means sellers are confident the market won’t fall. A PCR below 0.7 suggests too much call-side optimism, which sometimes precedes a pullback. It’s not a crystal ball but it’s a quick temperature check.
What is Open Interest in Options Trading?
Open interest is just a headcount of how many option contracts are still alive at any point. Not how many traded today that’s volume. OI tells you how many are still being held open. When a brand-new contract is created (a buyer and a seller both opening fresh positions), OI goes up by one. When an existing holder closes out against another existing holder, OI drops by one. If one is opening and one is closing, OI stays flat.
Here’s a number to make it concrete. Suppose the Nifty 24,000 call option shows an OI of 20 lakh contracts. That means 20 lakh contracts are currently being held some by buyers expecting Nifty to cross 24,000, some by sellers collecting premium betting it won’t. That number tells you how much money and conviction is parked at that specific strike. A strike with 20 lakh OI is a far more meaningful level than one with 50,000 OI. The market respects levels where big money has skin in the game. Everything else is just noise on the option chain.
How Call vs Put Open Interest Works with Examples
Let’s look at a real-ish scenario. Nifty is trading at 23,800 on a Wednesday morning. You pull up the option chain and see this:
Call side: Highest OI at the 24,000 strike 18 lakh contracts. The 24,200 strike has 11 lakh.
Put side: Highest OI at the 23,500 strike 14 lakh contracts. The 23,600 strike has 9 lakh.
What does this tell you? The market is expected to trade between 23,500 and 24,000 in the near term. The 24,000 call OI acts as the ceiling sellers there are defending that level. The 23,500 put OI acts as the floor sellers there don’t want the market to drop below.
Now watch what happens intraday. Nifty starts climbing towards 23,950 and you notice the 24,000 call OI increasing from 18 lakh to 22 lakh. That’s fresh call writing more people are selling calls at 24,000, which means they’re confident Nifty won’t break through. The resistance is getting stronger in real time. A savvy trader would think twice about buying calls at that level.
But and this is where it gets interesting if Nifty pushes past 24,000 and the call OI at that strike starts dropping, that’s short covering. The call sellers are admitting defeat and closing positions. That unwinding often fuels a sharp rally above the strike. Reading the OI change alongside the price move is what separates someone who understands the option chain from someone who’s just looking at numbers.
How Traders Use OI in Decision Making
The simplest and most useful application: before taking any trade, check where the highest call OI and highest put OI sit. Those two levels give you the market’s expected range for the week or the expiry. If you’re buying calls, you probably don’t want your target strike to be above the highest call OI level because that’s where the ceiling is.
Traders also track OI changes throughout the day. If the highest put OI strike shifts down say from 23,500 to 23,300 it means the support level is weakening. Sellers are no longer confident about defending 23,500 and are rebuilding positions lower. That shift is early warning that the market might be preparing to drop further. The opposite applies too. If call OI at the top strike starts evaporating while price pushes higher, resistance is breaking and momentum could accelerate upward. These shifts happen gradually over a session, sometimes over two or three days. Catching them early gives you a genuine edge over traders who only look at price charts.
Common Mistakes in Reading Call vs Put OI
Assuming high call OI means bullish: This is backwards more often than not. High call OI usually means a lot of people have sold calls at that level they’re betting the price won’t go higher. It’s resistance, not a buy signal. The same misread happens with itm call options where high OI sometimes reflects hedging activity, not directional bets.
Ignoring the change in OI: Looking at the absolute OI number once and building a trade around it misses the point. OI is a moving number. What matters is whether it’s growing (new money entering, level getting stronger) or shrinking (positions unwinding, level getting weaker). The direction of change is more important than the number itself.
Reading OI on expiry day as normal data: Option OI behaves strangely in the last two days before expiry. Contracts get closed, rolled to the next series, and OI swings wildly for structural reasons that have nothing to do with market sentiment. Treating expiry-week OI the same way you’d read mid-week OI leads to bad trades.
Looking at single strikes in isolation: The option chain is a landscape, not a single data point. An OI spurt at one strike might look significant until you notice that OI has also shifted across five neighbouring strikes. Always scan the full chain calls and puts before drawing any conclusions. Context matters.
Relying on OI without price confirmation: OI tells you where money is positioned. It does not tell you where price will go. Plenty of institutional positions built at high-OI levels end up wrong. Always cross-check with what the price is actually doing before acting.
Final Thoughts
Call and put open interest won’t hand you a guaranteed trade but they will show you where the weight of money is sitting in the market right now. That’s information most retail traders either ignore or misread. The highest call OI strike is your ceiling. The highest put OI strike is your floor. Track how those numbers shift through the day and through the week, and you’ll start seeing the market’s expected range before the move actually happens. Don’t overcomplicate it. Open the NSE option chain, note the top two or three strikes on each side, and compare them to yesterday. That ten-minute daily habit will teach you more about how options really work than most paid courses ever will.
FAQs
No, not on its own. OI shows where money is positioned, not where price will definitely go. Combined with price direction and volume, it provides useful context, but it’s never a standalone prediction tool.
No, actually the opposite is often true. High call OI usually means heavy call writing (selling) at that strike, which creates resistance. It signals that sellers are betting the price won’t go above that level.
Start by checking the NSE option chain daily. Find the strike with the highest call OI (your resistance) and the highest put OI (your support). Track how those levels shift each day that’s your expected trading range.
Moderately reliable as one input among several. OI shows conviction and positioning at specific levels, which is valuable. But it should always be combined with price action, volume, and broader market context before making any trade decision.