High trading volume is usually seen as a sign of conviction, but that assumption can be misleading. In reality, volume only shows activity, not whether traders are opening new positions or closing old ones. Without looking at open interest, a trader may completely misread the market. This disconnect between what looks strong and what is actually strong creates one of the most common traps in options trading. In this blog, we discuss the distinction between open interest vs volume to help you understand things better.
What is Open Interest in Options?
Open interest (OI) shows the total number of options contracts that are still active and not settled. It rises when new contracts are created between a buyer and seller, and it falls when existing contracts are closed. If contracts are simply transferred between traders, the OI remains unchanged. This measure displays how many positions are still open in the market.
What is Volume in Options Trading?
Volume refers to the total number of option contracts traded during a set time, usually one trading day. It records every contract bought and sold, whether it starts a new position or closes an old one. At the start of each trading day, options volume resets to zero. This makes it a direct measure of daily trading activity and market participation.
Open Interest vs Volume: Key Differences
Volume and open interest are both important indicators in financial markets, volume shows daily traded contracts; open interest shows total outstanding contracts. When comparing open interest vs trading volume, both measure different aspects of options activity. While both are important, they don’t mean the same thing. Here’s how they differ:
| Basis of difference | Open interest (OI) | Volume |
| Meaning | Total number of unsettled or outstanding contracts. | Number of contracts traded during a specific day. |
| Nature | A cumulative figure carried forward each day. | A daily figure that resets to zero. |
| Calculation | Rises when new contracts are created; falls when they are closed. | Every trade (buy/sell) counts toward daily total. |
| Insight provided | Shows how many positions remain active in the market. | Shows daily trading activity and liquidity. |
| Usefulness | Helps assess market participation over time. | Helps assess immediate interest in a contract. |
This makes the difference between open interest and volume clear: one reflects active positions, while the other captures daily turnover.
Why Volume Matters in Options Trading
Volume shows how much buying and selling an option is experiencing. Here’s why it matters:
- High volume shows strong participation, making it easier to buy or sell without large bid-ask differences.
- Price moves backed by high volume are generally more significant than those on low volume.
- Sudden spikes in volume often occur when news, earnings, or events prompt traders to act.
- Tracking volume helps understand if a price move attracts new participants or if activity is mostly existing positions changing hands.
- Consistent high volume can point to contracts that are highly liquid, reducing trading costs and slippage.
- Volume patterns over days can highlight periods of concentrated interest or unusually quiet trading, showing where market energy is focused.
Why Open Interest Matters
Open interest provides a measure of ongoing market participation in options. It’s beneficial in options trading in following ways:
- Rising open interest suggests that new contracts are being created, showing that more participants are entering the market and keeping positions active.
- Falling open interest shows that traders are closing contracts, reducing the total number of active positions.
- Certain strike prices with very high open interest often act as areas where many traders have positions, which can influence price behavior as expiry approaches.
- Tracking OI changes helps identify whether activity is expanding or contracting, revealing the level of interest in different options.
- Large increases in OI over several days may suggest sustained engagement in a contract, while sudden drops may indicate mass exits.
- Comparing OI across multiple strike prices allows observation of where most contracts are concentrated, highlighting key levels of participation.
- Studying OI alongside volume provides clarity on whether activity comes from new positions or closures.
How to Use Open Interest and Volume Together
Using both open interest vs volume provides insight into options activity, as follows:
- Strong bullish signal
When the price of the underlying asset rises along with high volume and increasing open interest, it indicates that new buyers are entering the market. This combination reflects active participation with fresh positions being created, supporting the upward move and making it more sustainable over time.
- Strong bearish signal
If the price is falling while both volume and open interest are rising, it shows that new sellers are opening positions. This scenario indicates active selling participation, with fresh short positions strengthening the decline and confirming that the downward move has solid backing.
- Possible weakness in uptrend (shorts covering)
When prices rise but open interest decreases, it often means that short sellers are closing their positions rather than new buyers entering. While the price moves higher, the lack of new positions suggests the uptrend may have limited strength and could slow down.
- Possible Weakness in downtrend (longs closing)
If prices fall while open interest declines, it indicates that existing long positions are being closed. Even if volume is high, the decline may not be strongly supported by new activity, showing reduced participation behind the move.
Real Example: Open Interest vs Volume Chart
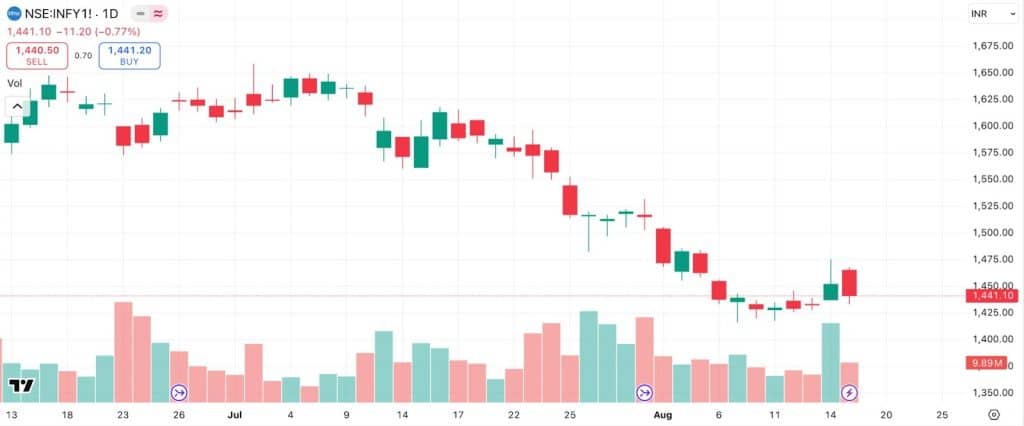
Let’s take an example to understand the core distinction of open interest vs volume better, let’s look at Infosys Futures. The volume on the first chart is 9.89 million. This is the specific number of Infosys shares that were traded today, Monday, August 18th. It’s a measure of today’s trading intensity for Infosys alone. This daily figure will reset to zero for tomorrow’s trading session.
The open interest (OI) on the second chart is 81.3 million. This is the total number of Infosys futures contracts that remain active and unsettled. This figure is cumulative and tells us the total size of the commitment traders have made specifically in Infosys futures over the entire august contract period.
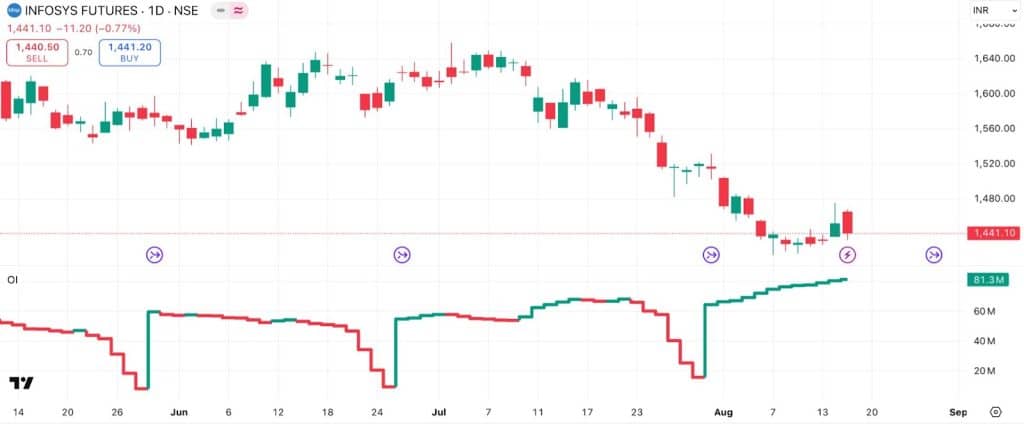
So, for Infosys, the 9.89M volume shows high trading churn today, while the 81.3M OI shows that a very large and growing number of positions on Infosys remain open.
Common Mistakes When Reading OI & Volume
Understanding open interest and volume requires care, as misinterpretation is common. Here’s how errors usually take place:
- Viewing them separately: Looking at OI or volume without considering price direction can be misleading. Rising OI may indicate different activity depending on whether the price is increasing or decreasing, making proper volume vs OI analysis essential.
- Confusing the two metrics: Volume tracks daily trades and resets each day, while OI is the total of active contracts. Mistaking one for the other can distort conclusions when comparing OI vs volume options.
- Ignoring expiration effects: OI naturally declines as options near expiry due to position closures or rollovers. Mistaking this routine drop for weakening market interest is a frequent error.
- Overlooking complex strategies: Large OI changes can come from spreads, straddles, or combination trades, not just simple calls or puts. This can make it harder to interpret market sentiment accurately.
- Assuming high volume equals new interest: Volume shows activity but does not distinguish between opening and closing trades. Misreading high volume as fresh buying or selling can lead to incorrect assumptions.
- Ignoring historical comparison: Evaluating OI or volume without comparing to past levels can exaggerate or understate their significance.
Final Tips for Traders
Important aspects of interpreting volume and open interest are listed as follows:
- Always interpret these measures alongside price movements and chart patterns to get a clear picture of market activity.
- Notice sudden spikes or drops in volume or open interest, as they often indicate significant shifts in activity for a contract.
- Remember that both are historical records showing what has already occurred and do not predict future price changes.
- Compare current levels of volume and open interest with their typical ranges for that option to understand whether activity is unusually high or low.
- Consider that these metrics reflect the actions of all participants, from small retail traders to large institutional players, rather than the intentions of any single trade.
- Use volume and OI together rather than separately; observing both can clarify whether strong trading activity comes from new positions being created or existing positions being closed.
- Track changes over multiple days instead of focusing only on daily movements, as cumulative patterns often provide a more accurate picture of sustained market interest.
- Monitor strike prices with high OI, since these often become focal points where significant positions are concentrated, affecting price behavior near expiry.
Conclusion
The difference in open interest vs volume goes beyond simple figures. Volume records immediate trades, while open interest shows contracts that remain open. When viewed together, options volume vs open interest gives a layered view of daily action and lasting positions. This mix helps separate short bursts of trading from commitments that stay, offering a balanced way to read the flow of the options market.
FAQs
Open interest is the total number of outstanding option contracts that haven’t been closed or exercised. Volume is the number of option contracts traded during a specific period (usually one day). Volume tracks daily activity; open interest shows the ongoing presence of contracts in the market.
Rising volume and open interest together signal strong participation and potential trends. If volume increases but open interest stays flat, trades may be closing rather than opening new positions. Use both to gauge market strength, trend direction, and confirmation before entering an options trade.
Neither is always “more important”, they complement each other. Volume shows immediate buying and selling action; open interest reflects longer-term interest and liquidity. Analyzing both gives a clearer picture of whether market moves are likely to be sustainable or fleeting.
Yes. Volume represents daily trade count, while open interest is ongoing contract totals. On high activity days, volume can exceed open interest if many contracts open and close within the same day, especially around earnings or major news.
High open interest suggests there are many active contracts and interested market participants. It can indicate strong conviction, deeper liquidity, and often precedes major price moves or volatile conditions, as more traders are actively betting on the underlying.
Higher open interest usually improves liquidity, making it easier to enter and exit positions with minimal price slippage. Markets with low open interest can be harder to trade and may involve wider bid-ask spreads, impacting trade execution and potential profits.
High volume showcases increased trading activity and short-term interest in a specific option. It often signals news-driven moves, changing sentiment, or unusual events. High volume by itself shows action, but doesn’t guarantee trends unless supported by changes in open interest.
If both are rising, it points to strong, new participation and often confirms a trend. In contrast, rising volume with falling or flat open interest may signal profit-taking or position closing. Jointly interpreting these helps assess the market’s conviction, trend stability, and liquidity.