In the current market landscape, many traders face whipsaws and sudden swings that erode their gains and frustrate the execution of standard trend tactics.
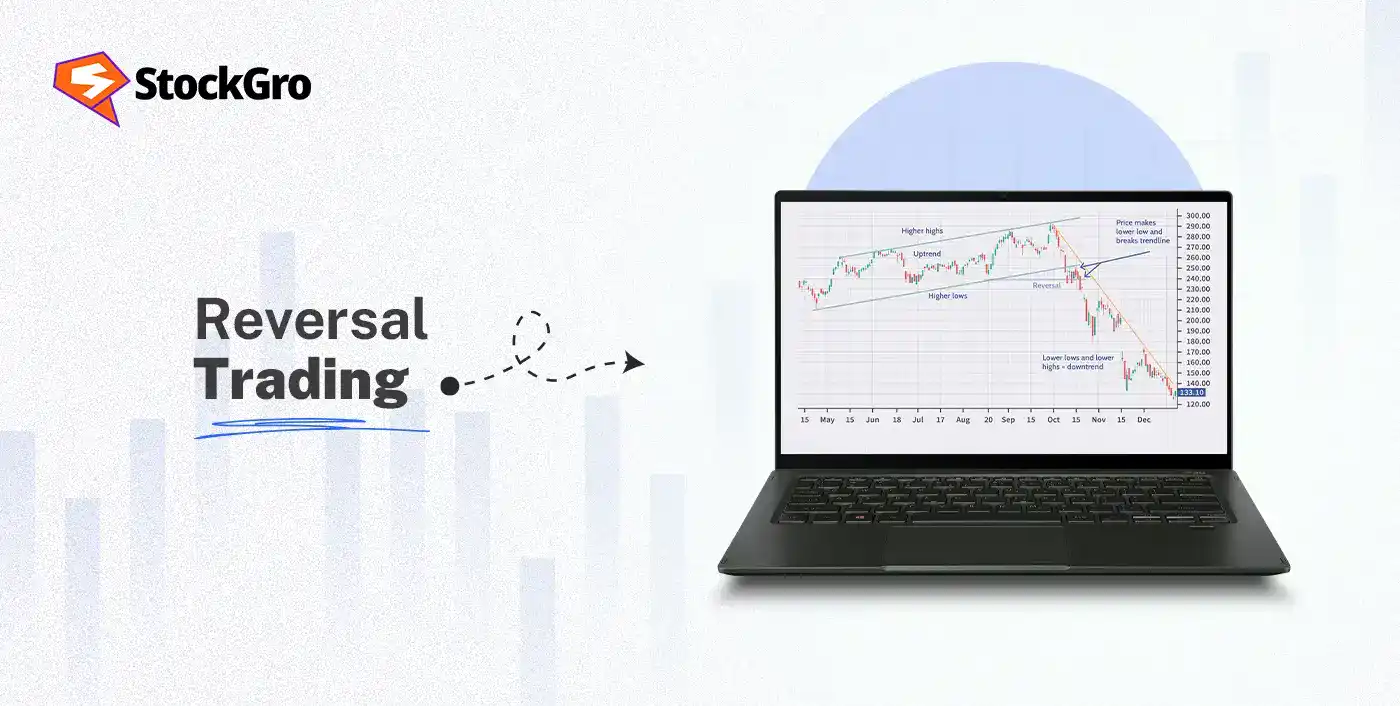
In such conditions, reversal trading becomes a structured approach to identify the exact point where an uptrend turns bearish or a downtrend shifts bullish. Market participants often debate the reliability of reversal signals and wrestle with the ambiguity that arises around turning points in price action and momentum indicators.
This article discusses reversal trading, how it works with patterns and indicators, and how it differs from pullback and retracements.
What is Reversal Trading?
In technical analysis of financial markets, reversal trading is a structured approach that aims to capitalise on shifts in existing price trends when the momentum of an existing uptrend or downtrend weakens and ultimately changes direction. It does not follow a continuing trend. Instead, it waits for evidence that market sentiment has shifted sufficiently to signal the end of a directional move and the emergence of an opposite trend.
Why Does Reversal Trading Matter?
Understanding reversals equips traders with the ability to detect actual trend changes at major price turning points and improve timing, risk control, and profit opportunity across volatile markets.
- Captures major trend transitions:
It identifies the point where demand overtakes supply or supply overpowers demand, which marks a structural shift in market direction. These points usually precede bullish or bearish phases that offer meaningful price movement.
- Protects capital at inflection points:
When the traders recognise reversal signals, it enables them to exit weakening trends before losses compound, while reducing the risks during late-stage trend exhaustion, where continuation strategies usually fail.
- Improves strategic flexibility:
By distinguishing reversals from pullbacks and retracements, traders gain the ability to operate in both rising and falling markets.
Reversal vs Pullback vs Retracement
Understand how reversal differs from pullback and retracement through a comparative study of the three:
| Aspects | Reversal | Pullback | Retracement |
| Definition | A sustained change in the existing trend direction | Pullback is a brief pause or minor decline within an existing trend | Retracement is a temporary price correction against the main trend |
| Trend Impact | It marks the current trend’s end and a new trend’s beginning | It doesn’t change the ongoing trend | It doesn’t change the direction of the ongoing trend |
| Duration | Medium to long term shift | Short term movement | Short to intermediate correction |
| Market Psychology | It shows transfer of control from the buyers to sellers, or vice versa | Temporary profit booking within trend | Partial unwinding of prior price movement |
| Chart Structure | Break of key support or resistance with structural change | Price holds above support in uptrend or below resistance in downtrend | Often measured using percentage or Fibonacci levels |
| Trading Approach | Entry in the new emerging trend direction | Entry in direction of existing trend after minor dip | Entry aligned with primary trend after corrective move |
| Risk Level | Higher uncertainty during confirmation phase | Lower risk if trend remains intact | Moderate risk depending on depth of correction |
How Reversal Trading Works
Reversal trading operates by identifying signs of trend exhaustion, confirming structural breakdown or breakout, and entering positions when evidence supports a sustained change in market direction.
Bullish Reversals Explained
A bullish reversal takes place when an existing downtrend loses its momentum, and the demand gradually absorbs supply, which leads to a transition towards higher prices. The patterns, such as double bottoms or inverse head and shoulders formations, often accompany this change.
Bearish Reversals Explained
A bearish reversal develops when an established uptrend weakens as the selling pressure begins to outweigh buying interest, which results in a downward transition. The formations, such as double tops or head and shoulders patterns, frequently precede such declines.
Key Tools to Identify Reversals
Reversal identification requires a combination of structural analysis, momentum evaluation, and disciplined execution principles to distinguish genuine trend changes from temporary price corrections within an ongoing trend.
Price Action Patterns
The price action trading provides the earliest visual evidence of a potential reversal. Formations such as double tops, double bottoms, head and shoulders, and inverse structures reflect the shifts in demand and supply dynamics. These patterns gain reliability when they’re accompanied by contraction in momentum followed by decisive breakout beyond the neckline or structural boundaries.
Support & Resistance Levels
The support resistance guides through the price zones where the pressure of buying or selling has historically altered the market direction. A reversal usually develops when the price fails to sustain movement beyond a significant level and subsequently breaks in the opposite direction.
Momentum Indicators (RSI, MACD)
The momentum indicators measure the speed and strength of the price trend. The Relative Strength Index (RSI) measures the magnitude of recent price movements to assess whether a security is trading near extreme levels, whereas the Moving Average Convergence Divergence (MACD) evaluates changes in momentum by analysing the relationship between moving averages and the behaviour of its signal line and histogram.
Simple Entry/Exit Rules
Reversal trading requires clearly defined entry criteria, usually after confirmation of pattern completion and level break. The stop loss placement is set beyond recent swing highs or lows to limit adverse movement. And, profit targets are aligned with prior support or resistance zones to maintain favourable risk-to-reward parameters.
Common Timeframes
Reversals may occur across multiple timeframes, from intraday charts to weekly structures. The higher timeframes generally produce stronger and more sustained reversals due to broader participation. The lower timeframes offer earlier signals but carry increased noise and require stricter confirmation to avoid false breakdowns or breakouts.
Reversal Trading Patterns
Reversal patterns represent recurring price formations that signal a structural shift in trend direction, reflecting a measurable transition in market control from buyers to sellers or vice versa.
Double Tops & Double Bottoms
A double top pattern is a bearish reversal structure that emerges near the end of a sustained upward movement, characterised by two distinct peaks formed at approximately the same resistance zone, where the second attempt fails to establish a new high.
A double bottom represents a bullish reversal structure appearing after a sustained decline. The price approaches a defined support level on two separate occasions and is unable to extend the decline, indicating that selling pressure is gradually losing strength at that zone.
Head & Shoulders Patterns
The head and shoulders pattern develops near market tops, which consists of three successive peaks, where the middle peak rises above the two adjacent peaks that surround it. The breakdown below the neckline confirms a shift from accumulation to distribution, suggesting the start of a downward trend.
Triple Top and Bottoms
A triple top is a bearish reversal formation that develops after a prolonged advance, where the price tests a resistance zone three times without establishing a sustained breakout. Each failed attempt reflects diminishing buying conviction and increasing supply near the same level. This is confirmed once the price declines beneath the intervening support level that connects the reaction lows between the peaks, indicating a transition from accumulation to distribution.
A triple bottom is the bullish counterpart, formed after an extended decline. The price tests a support level three times, indicating strong demand absorption, where a breakout above the resistance confirms accumulation and the potential beginning of a sustained upward move.
Sushi Roll Reversal Pattern
The sushi roll reversal pattern is a formation that reflects a transition from narrow consolidation to expanding price movement in the opposite direction. It begins with a series of small, contained price bars followed by a wider range structure that engulfs the prior consolidation.
Inverse Head and Shoulder
The inverse head and shoulders signals a bullish reversal after a downward trend. It is composed of three successive troughs, in which the middle trough descends to a level below the two surrounding troughs, forming the deepest point of the structure. A decisive breakout above the neckline confirms renewed buying strength and the transition toward a rising trend.
Pros & Cons of Reversal Trading
Reversal trading offers substantial opportunity at major turning points, but it also carries structural uncertainty.
| Pros | Cons |
| It allows traders to enter positions near major turning points, which can provide profit potential if the new trend sustains. | Reversal trading carries a high probability of false signals, as reversals may turn out to be temporary pullbacks. |
| It offers a favourable risk to reward structure because stop-losses can be placed close to recent swing. | Confirmation of a reversal occurs after part of the move has already unfolded, which can complicate execution. |
| This approach applies to both upward and downward market conditions, enabling participation in directional shifts across trends. | It requires precise timing and disciplined analysis, since premature entries may result in losses if the prior trend continues. |
Risk Management in Reversal Trading
Risk management strategies in trading are essential, as positions are initiated at potential turning points where uncertainty remains elevated.
- Capital allocation: The traders should limit risks to a small percentage of total trading equity on each position.
- Position sizing: This should remain conservative because reversal setups generally involve a higher probability of false signals.
- Stop-loss: This must be placed beyond recent swing highs in bearish trades and below recent swing lows in bullish trades to define invalidation levels.
- Trade confirmation: A trader should enter a position only after structural confirmation appears, to reduce premature risks against the existing trend.
Conclusion
Reversal trading is a structured method within technical analysis that seeks to identify decisive shifts in market direction. By combining price action patterns, support and resistance levels, and momentum indicators such as RSI and MACD, traders attempt to distinguish genuine trend changes from temporary pullbacks or retracements.
When supported by disciplined risk management and confirmation rules, reversal trading can enhance timing, protect capital, and improve strategic adaptability across varying market conditions.