Intraday trading goes beyond just making quick decisions. It involves why and how the prices are moving in a single trading session. When you understand the movement and align your decisions with the market behaviour, your trading approach becomes more structured and less reactive.
In this guide, we explore intraday indicators, strategies, and how to apply them effectively.
What is Intraday trading?
Intraday trading involves purchasing and selling shares during a single trading session. The positions are closed before the market ends. The objective here is to take advantage of the short-term price movements.
Unlike traditional investing, intraday trading emphasises timing and swift decision-making. The prices move due to market participation, news, and sentiment during the day. Traders focus on capturing minor price fluctuations that can build into gains over several trades.
As the positions are not carried over, it reduces the overnight risk, but it requires active monitoring of the market activity.
Intraday Trading Indicators
The market leaves clues in price and volume. Intraday Indicators help traders interpret these clues and make informed trading decisions. The indicators used most frequently are:
- Moving Averages
Moving averages track a stock’s average price over a set time frame. They smooth out price fluctuations to reveal the overall trend direction.- Simple Moving Average finds the average price by assigning equal weights to the price data and is slow in nature.
- Exponential Moving Average responds quickly to the market movements by assigning higher weights to the recent price changes.
- Relative Strength Index (RSI)
The RSI is used to determine the market conditions. It is a momentum oscillator ranging from 0-100. RSI scores above 70 indicate overbought conditions, and RSI dropping below 30 reflects oversold conditions. - Bollinger Bands
Bollinger bands help in measuring the volatility by using upper and lower bands around the price. They are used to identify overbought/oversold conditions and potential breakouts. - Moving Average Convergence Divergence (MACD)
The MACD is a trend-based indicator that highlights the correlation between two moving averages. It is used to identify shifts in momentum and potential reversals. - Volume Weighted Average Price (VWAP)
The VWAP shows a security’s average price by accounting for both the price and volume. Using the weighted volume gives a fairer representation of the price changes. Traders identify the trend direction and take positions based on VWAP signals.
Intraday Trading Strategies
A good strategy brings structure to intraday trading and reduces emotional decisions. Several popular intraday trading frameworks include:
Trend Following
In a trend following approach, trades are made in the direction of the market.
Higher highs and higher lows show an uptrend where traders seek buying opportunities. Lower highs and lows signal a downtrend, where traders look to sell.
Indicators like moving averages are used to confirm the trend and avoid trading against it.
For example, a stock moves from ₹100 to ₹106 over time, forming higher lows around ₹103. A trader identifies the uptrend and enters near ₹105, then exits near ₹110 as the trend continues, capturing the directional move.
Breakout Strategy
A breakout strategy involves entering a trade when the price crosses above or below major support or resistance zones.
These zones serve as critical points where the price frequently pauses or reverses, but once broken, strong momentum is likely to follow. Volume is essential for validating the strength of a breakout.
As an example, suppose a stock has been trading between ₹200 and ₹210 for quite a while. When it finally breaks the ₹210 level with high volume, a trader enters at ₹213. The momentum continues upward, and the trader exits his position at ₹220, benefiting from the sharp price breakout.
Reversal Strategy
In a reversal setup, the focus is on points where the current trend may change its direction.
Traders use indicators such as the RSI, Bollinger bands, or support and resistance to identify market conditions and anticipate a potential reversal.
Example: Assume the price of a stock falls from ₹300 to ₹275 and its RSI drops to 20, signalling that the stock is currently in an oversold phase. As the price starts to recover, a trader enters near ₹280 and continues to ride the momentum before taking an exit at ₹295.
Momentum Trading
Under this method, traders look for stocks that are moving in one direction with high participation levels.
Traders aim to take an early position and exit before the trend starts losing its strength. It calls for rapid decisions and continuous tracking of price movements.
For instance, a stock rapidly rises from ₹150 to ₹160 within a short period. A trader enters at ₹157 as momentum builds and exits at ₹163–₹165, capturing the continuation of the strong price movement.
How to select Intraday stocks?
When choosing intraday stocks, evaluate the following key factors:
- Liquidity: It indicates the availability of buyers and sellers. Stocks with high trading volume enable entering and exiting positions smoothly and with minimal price slippage.
- Technical Indicators: Analysing stocks using indicators like VWAP, moving averages, or RSI provides clear signals. When the stock aligns well with the indicators, it increases confidence in trade setups.
- Volatility: Intraday trading depends on price movement. Stocks showing regular fluctuations provide more opportunities to capture profits, but the volatility should be controlled, as unpredictable movements can increase the risk.
- Clear Trend or Setup: Stocks that are already in a trend or forming patterns like breakouts, pullbacks, or reversals are easier to trade. Clear price structures help in planning the entries and exits more effectively.
- News or Events: News, earnings announcements, or macroeconomic changes can increase a stock’s activity. This often creates strong intraday moves, making such stocks attractive for traders looking for short-term opportunities.
- Sector Strength: Stocks usually move in line with their sector. If a particular sector is doing well, stocks in that sector are likely to perform as well. Tracking the sector trends can improve stock selection.
HCL Tech’s price movement on April 2, 2026, helps in understanding what an intraday setup looks like when these factors align:
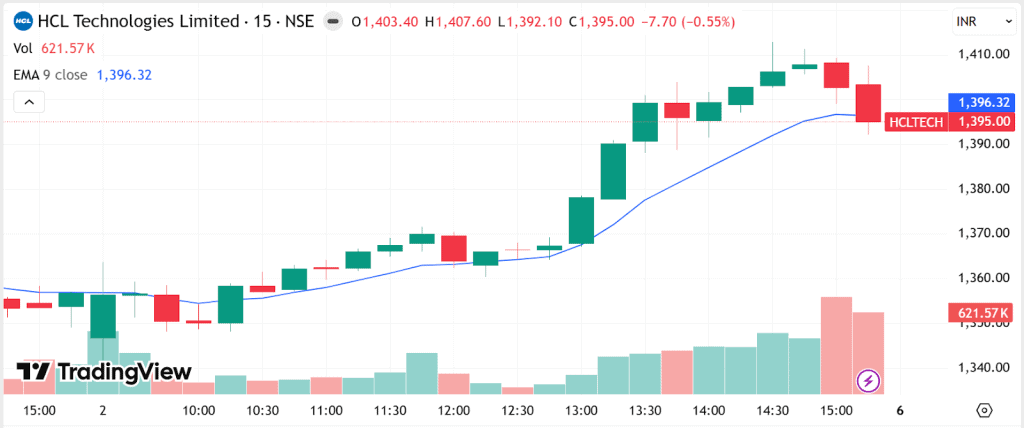
Note: The example used is not an investment recommendation. Investors are advised to conduct their own research before making a decision.
- The price opens near ₹1,360 and starts moving towards ₹1,370, staying close to the EMA line. This is where traders wait and observe before taking any position.
- After 1:00 PM, there was a sudden surge in volume, and the price crossed the EMA and started climbing toward ₹1,400. An entry can be taken here to follow the momentum.
- Between 1:45 PM and 2:00 PM, the price stalled close to ₹1,390, making it a safer entry with a better risk-to-reward ratio.
- The price peaks at 2:30 PM, reaching almost ₹1,410. This is a good zone to exit and book profits before the price momentum starts fading as the market closes.
Conclusion
Intraday trading offers opportunities, but success depends on discipline, strategy, and understanding the market behaviour. By using the right indicators and following a structure, we can improve our decision-making, which leads to consistent results.
Instead of chasing quick profits, focusing on risk management and clarity helps build a sustainable intraday trading approach.
FAQ‘s
Earning ₹1000 daily requires a proper strategy, risk management, and discipline. Focus on liquid stocks, use clear setups, and avoid overtrading. Consistency matters more than chasing profits in every trade.
Yes, intraday trading can be profitable if done with the right approach. Traders who understand market behaviour, manage risk, and follow a disciplined strategy have better chances of making consistent returns.
The 3-5-7 rule is a risk management strategy. It means risking up to 3% per trade, limiting total exposure to 5%, and aiming for a 7:1 risk-reward ratio. This helps protect capital, avoid overleveraging, and ensures profitable trades can cover potential losses.