Day trading moves quite fast, and identifying and measuring the strength of a trend can make an actual difference. That’s where the ADX indicator steps in. It doesn’t tell a trader which way prices are moving or will move, but it tells how strong that move really is.
Whether the market is moving up, down, or sideways, the ADX shows if the move has momentum or if it is losing steam. So, understanding ADX indicators and how to use ADX indicators for day trading can help traders avoid false signals and trade only when trends are worth chasing.
Read this blog further to understand ADX indicators, +DI and –DI lines, and learn how to use ADX indicators for day trading.
What is the ADX Indicator?
The Average Directional Index (ADX) indicator is a tool for technical analysis, which measures the strength of a trend, but not the direction. It helps the traders to ascertain if the market trend is strong or if it is range-bound. The ADX value can range between 0 to 100, and a higher ADX value indicates a stronger trend.
| Range | Indicator of? |
| 0–25 | This range marks a low ADX value, indicating a weak or non-existent trend. |
| 25–50 | An ADX within this range, indicates a strong trend is developing or is continuing. |
| 50–75 | An ADX within this range points to a stronger price trend. |
| 75–100 | This range is quite rare, and it signals an extremely strong price trend. |
Understanding +DI and -DI Lines
The Positive Directional Indicator (+DI) and the Negative Directional Indicator (-DI) lines are two components of ADX, which respectively measure the strength of upward or bullish and downward or bearish price movements. The day traders use these lines to ascertain a trend’s direction, while the ADX line confirms the strength of the trend.
Let’s understand how +DI and –DI work together with ADX:
- The ADX is used along with +DI and -DI.
- While the +DI and -DI lines show the direction of a trend, the ADX measures its strength or magnitude.
- Traders use the ADX in combination with the +DI and -DI lines to confirm the signals.
For example, Coforge Ltd. shares are trading at ₹500 per share, and over the next few sessions, its price rises to ₹530, showing buying pressure. In the ADX chart, if the +DI line crosses above the –DI line, it indicates the buyers are gaining control. And at the same time, the ADX value rises above 25, confirming that the uptrend is strong and is likely to continue. In such cases, a trader might consider entering a long position.
How to use ADX indicator for day trading
The ADX indicator for day trading is used in combination with +DI and -DI to identify and measure strong trends.
- Identify strong trends: It is suggested that the traders shall trade only when the ADX is above 25, as this indicates a developing strong trend.
- Understand entry and exit signals: The bullish signal usually goes long, while the bearish signal goes shorter, so traders should watch for +DI crossing above -DI or vice versa when the ADX is above 25 and rising to confirm a strong trend.
- ADX for risk management: A falling ADX reading or an ADX below 25 signals that the trend is weakening, urging traders to close a position to protect profits.
- Adjust ADX settings: The default setting ADX of 14 periods could be slow for day trading. So, traders can consider using a shorter period, for example, 7, to get faster signals on the charts.
Setting Up ADX for Day Trading
Step 1: Setting up the ADX indicator
The traders start by adding the ADX indicator to their trading platform, and then adjust the settings for faster signals on shorter timeframes, or use a shorter period, as the default setting.
Step 2: Identifying strong trends
Next, the traders observe the ADX line to know when it moves above 25, which signals that a strong trend is forming. If the ADX rises, it means the strength is building, while if it falls, it means the trend is losing steam. Traders use this to skip sideways markets and to focus only on setups where the trend has real strength.
Step 3: Identifying the trend direction
Then, the traders check the +DI and -DI lines alongside the ADX. When +DI is above -DI and the ADX is above 25, it suggests a strong upward trend. If -DI moves above +DI with a strong ADX, the market is bearish and is a possible setup for short positions.
Step 4: Placing entries and exits
The traders might enter a long position when +DI stays above -DI and ADX climbs over 25, which shows a strong buying pressure. And they might enter a short trade when -DI leads and ADX rises above 25, signaling a bearish movement. The traders may exit trades if the opposite crossover occurs, suggesting the trend is losing its strength.
Combining ADX with Other Indicators
The ADX is a powerful indicator that measures the trend’s strength, and combining it with other indicators that provide momentum or directional analysis enhances its efficiency.
| Indicators | Function | ADX x Other Indicators |
| +DI and -DI | It identify the trend direction | The ADX inherits +DI and -DI. So, when +DI is above -DI, the trend is upward, and when -DI is above +DI, the trend is downward. With this, the ADX confirms the trends’ strength and its direction. |
| Moving averages Convergence Divergence (MACD) | It shows momentum changes and probable reversals | When MACD shows a bullish crossover and the ADX is above 25, it confirms a strong trend strength. This helps to avoid false signals during weak trends.. |
| Relative Strength Index (RSI) | It measures momentum and overbought or oversold conditions | The RSI highlights probable reversal points, while ADX confirms if the ongoing trend has the strength to sustain or reverse. |
| Volume | It confirms conviction behind price movements | Volume verifies the conviction of price movements, and ADX ensures that high volume aligns with a strong and reliable trend direction. |
Real-Life Examples of ADX in Action
This chart of Mahindra & Mahindra Ltd. shows how the ADX indicator along with +DI and -DI helps in identifying trend strength and its direction.
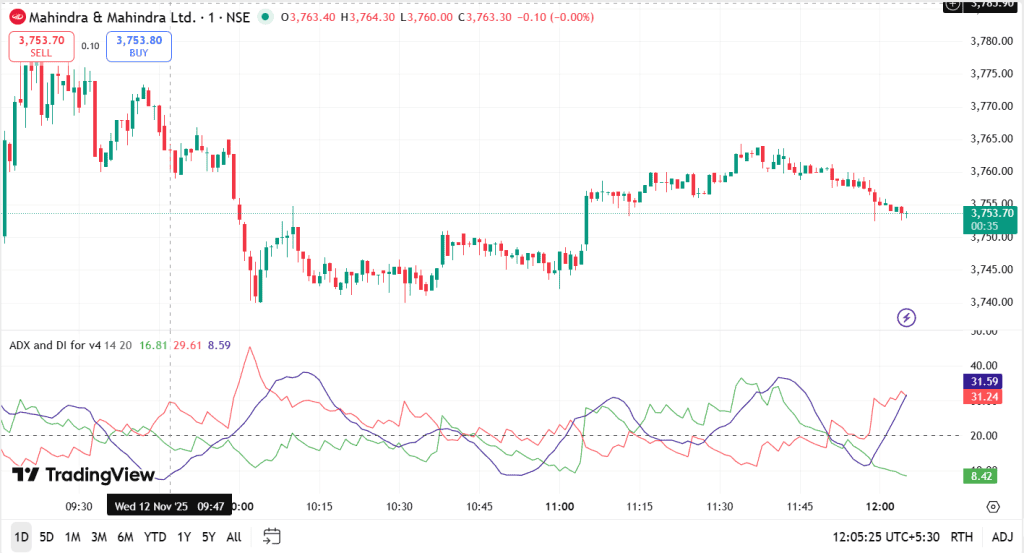
Here, the lines in the chart depict:
- The green line (–DI) shows selling pressure, and the red line (+DI) shows buying pressure.
- When –DI crosses above +DI (at around 9:45), sellers dominate and prices fall.
- Later, +DI crosses above –DI ( at around 11:00), showing buyers gaining control.
- The blue ADX line measures trend strength, and a rising ADX means the trend is getting stronger.
Common Mistakes to Avoid with ADX
- Relying only on ADX: The ADX only measures trend strength, not its direction or entry or exit points. So it is important to combine it with other directional tools like the +DI and -DI lines, or price action.
- Trading in low-ADX markets: The ADX readings below 20-25 indicate a weak or non-existent trend, and lead to false signals if the trade follows trend strategies, which shall be avoided.
- Misinterpreting a falling ADX: A declining ADX value simply means the trend is losing momentum or entering a consolidation phase, not necessarily that it will reverse direction.
- Ignoring the ADX slope: The ADX line’s slope is important as a rising ADX signifies an increasing momentum, while a falling slope indicates weakening momentum, even if the value is still high, for example, falling from 40 to 30.
Conclusion: Mastering ADX for Day Trading
Mastering the ADX indicator helps traders to focus on trends that actually matter. It filters out noise, marks strong price moves, and prevents entries during weak or sideways markets. When paired with +DI, –DI, and other indicators, the ADX becomes a much more reliable tool for timing entries, exits, as well as managing risk with precision.
FAQ‘s
The ADX indicator measures the strength of a price trend, which helps traders identify whether the market is trending or range-bound. It’s used to filter trades and confirm momentum before entering into positions.
The +DI and –DI lines indicate the trend’s direction; the +DI shows upward movement, and the -DI shows downward movement. The ADX combines both of these to measure how strong that trend is, regardless of the direction.
The day traders usually shorten the default 14-period setting for quicker responses. The shorter periods make the ADX more sensitive to fast market moves.
No, because the ADX measures the trend strength and not the direction. So it is used alongside +DI, -DI, or traders can combine other tools like RSI or MACD to confirm trade entries and exits.
A falling ADX value signals that a strong trend is losing steam, which may hint at consolidation or a reversal. However, the traders confirm trend reversals using +DI and -DI crossovers or other tools.
The common mistakes might be such as avoiding trading when ADX is below 25, mistaking a falling ADX for a reversal, or ignoring the slope changes. The traders must always pair the ADX with directional indicators to prevent any false signals.
While compared to tools like RSI or MACD, which show momentum and reversal points, ADX focuses purely on trend strength. It’s most effective when used together with these tools for confirmation.