Table of contents
Intraday trading has always been a popular choice among traders for its fast-paced nature and the potential to generate instant rewards. To engage in intraday trading, one must purchase and sell equities within a single trading day.
But becoming a successful intraday trader requires a sharp eye for patterns and indicators that might help predict price changes in a single trading day. This brings us to the market’s secret weapon: intraday trading chart patterns.
Let’s look at what they are and how you can use them for successful intraday trading.
What are intraday chart patterns?
A chart pattern is an outline seen on a price chart that serves as a guide for future price movements based on historical data. A chart pattern for intraday trading usually shows how prices change over time within a single trading day.
Traders may use these patterns to pinpoint price reversal, breakout, and trend levels. These charts help analyse different time frames, and using them may improve better decision-making. Intraday charts provide a clear picture of a certain security’s activity. Whether it’s the triangle or the candlestick patterns used in intraday trading, each pattern serves as a signal for the next potential move.
Top 10 Intraday Chart patterns
Head and shoulders pattern
Double top and double bottom
Flags and pennants
Cup and handle
Wedges (rising and falling)
Triangles (ascending, descending, symmetrical)
Gaps (breakaway, runaway, exhaustion)
Rectangles
Rounding bottom
Candlestick-based patterns (Doji, Hammer, Engulfing)
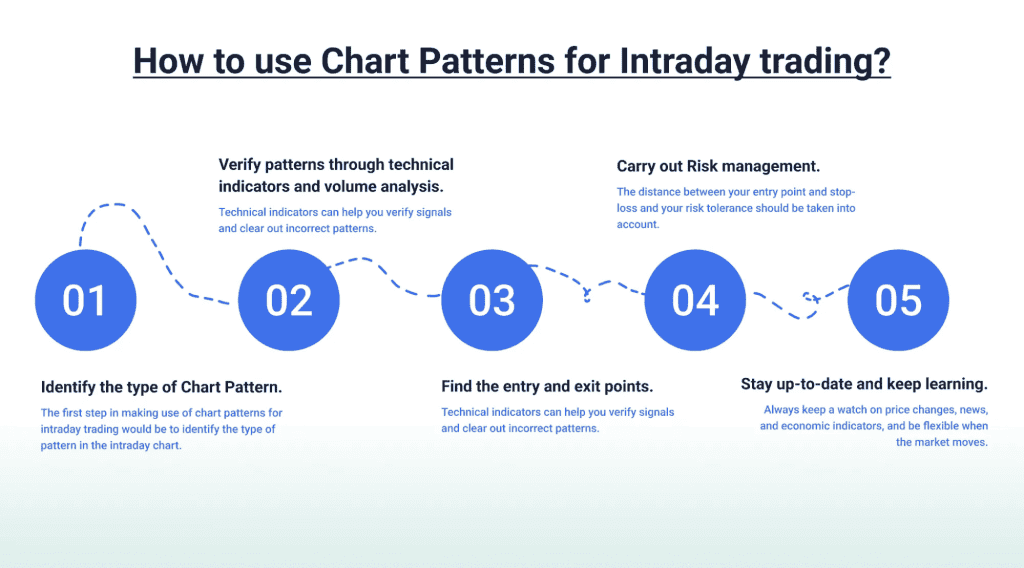
How to use chart patterns in intraday trading?
The following are some essential guidelines for recognising and trading intraday chart patterns:
Technical analysis tools
- Trend lines: You can see where the market is heading and when it could reverse by drawing trend lines.
- Moving averages: By minimising price volatility, such indicators reveal patterns and levels of support and resistance.
- Volume analysis: You can tell how strong a trend is or whether it’s about to reverse by looking at trade volume along with price fluctuations.
Entry and exit techniques
- Suitable time frame: Pick a 5-minute, 15-minute, 30-minute, or 60-minute chart that suits your needs. The time interval should capture intraday price movements, patterns, and indications.
- Confirmation signals: Before making a trade, make sure to check for confirmation from other indications or patterns.
- Stop-loss placement: You may minimise your potential losses if the trade goes wrong by using stop-loss orders.
- Profit target setting: Set your profit objectives according to the levels of support and resistance or additional technical indicators.
Importance of chart patterns in intraday trading
1. Predictive insights into market behaviour: Chart patterns reflect the collective actions and sentiments of market participants. By studying these patterns, traders can forecast potential price movements, allowing for timely and strategic trading decisions.
2. Enhanced risk management: Recognising chart patterns aids in setting precise stop-loss and take-profit levels. This precision helps in managing risks effectively, ensuring that potential losses are minimised while maximising gains.
3. Identification of market trends: Chart patterns help in distinguishing between bullish, bearish, and sideways markets. This identification is crucial for traders to align their strategies with the prevailing market conditions.
How to identify and read chart patterns
1. Understand the basic types of patterns
- Continuation patterns: Indicate that the current trend will likely continue. Examples include flags, pennants, and rectangles.
- Reversal patterns: Suggest a change in the current trend. Common examples are head and shoulders, double tops, and double bottoms.
- Bilateral patterns: Show that the price could move in either direction. Triangles often fall into this category.
2. Utilise appropriate timeframes: For intraday trading, shorter timeframes like 1-minute, 5-minute, or 15-minute charts are commonly used. These timeframes provide detailed insights into price movements within the trading day.
3. Incorporate volume analysis: Volume plays a significant role in confirming chart patterns. For instance, a breakout accompanied by high volume is more reliable than one with low volume.
4. Practice pattern recognition: Regularly reviewing historical charts and practicing pattern identification enhances a trader’s ability to quickly recognize patterns in real-time trading scenarios.
Conclusion
Your success rate in intraday trading may dramatically increase if you can identify and interpret intraday chart patterns. By analysing these patterns and incorporating them into your trading strategy, you may precisely determine when to enter and exit a position for a profitable trade.
However, in intraday trading, it is hard to overstate the importance of risk management and thorough knowledge of the patterns.
FAQs
Popular intraday chart patterns in India include:
Head and Shoulders
Double Top/Bottom
Flags and Pennants
Triangles (Ascending, Descending, Symmetrical)
Wedges (Rising/Falling)
Cup and Handle
Candlestick patterns (Hammer, Doji, Engulfing)
Yes, beginners can use chart patterns effectively. Start with simple patterns like Double Top/Bottom and Triangles, and practice spotting them alongside support/resistance levels.
The most profitable chart patterns include:
Cup and Handle
Head and Shoulders
Ascending Triangle
Bullish/Bearish Engulfing
Flags and Pennants
These offer reliable entry and exit points.
Candlestick charts are the best for intraday trading as they show price action and market sentiment clearly, helping to spot trends and reversals.
Effective price action patterns include:
Pin Bar
Engulfing
Inside Bar Breakout
Support/Resistance Breakouts
These help identify momentum shifts and entry points.
Common patterns for momentum traders (Intraday Hunters) include:
Breakouts (Flags, Triangles)
Reversal Candles (Hammer, Engulfing)
Volume Breakouts
These patterns capture quick, strong moves in the market.
For intraday, use:
1-5 minutes for quick entries
15-minute for trend view
1-hour for confirmation
A combo of 5-minute for entry and 15-minute for trend is ideal for beginners.