Ever bought a stock thinking it was about to rise but then it crashed a minute later? This biggest challenge intraday traders face is misreading price strength. A stock may look like it’s breaking out, but without checking what’s happening, you could walk into a trap.
But momentum oscillators can help you know if a price move is fake or done by institutional investors. Tools like RSI and MACD help you go for better entries, exit before a reversal, or avoid getting stuck in sideways action. In this blog, we’ll look at how to use momentum oscillator in intraday trading and how to avoid common mistakes.
What is a momentum oscillator?
A momentum oscillator is a technical indicator that tells you how quickly the price is changing. This tool measures the rate of a price change and looks at how today’s price compares to the price n days ago. If it’s rising fast, momentum is on the bull’s side. If it’s dropping hard, bears are gaining grip.
How do momentum oscillators work in intraday trading?
Here’s how momentum oscillators play their part in intraday trading:
Momentum oscillators like RSI (Relative Strength Index), Stochastic Oscillator, and Intraday Momentum Index (IMI) track the relationship between a stock’s closing price and its recent price range. Say a stock hits a new high but your oscillator stays flat, this mismatch is called divergence.
Best momentum oscillators for intraday trading
When you’re trading intraday, you need tools that react fast, flag overbought and oversold zones clearly, and catch momentum shifts.
Check out the best momentum oscillators that can help you in intraday trading.
1. RSI
RSI compares recent gains to losses over a 14-period stretch. It moves between 0 and 100.
Intraday Use:
- Above 70: Signals an overbought stock, often seen before a price pullback.
- Below 30: Signals oversold pressure, a possible setup for a bounce.
Divergences:
When price makes a higher high and RSI does not, momentum is cooling off and you must watch for a reversal.
2. Stochastic oscillator
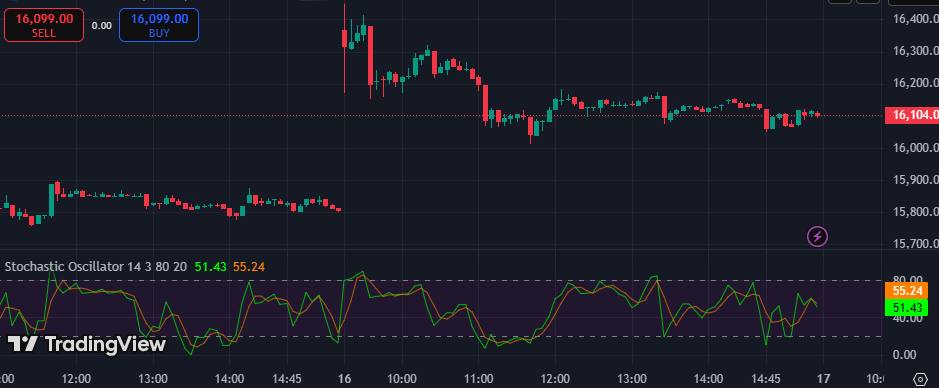
It measures the closing price relative to its recent high-low range and moves from 0 to 100. If it’s above 80, you must watch for exhaustion in buying. While below 20 signals oversold action.
The early signs of reversal is that the price will make a new low but the oscillator holds higher. But if the price makes a new high but the oscillator does not hold the higher values, it means that the upside movement is fading.
3. MACD
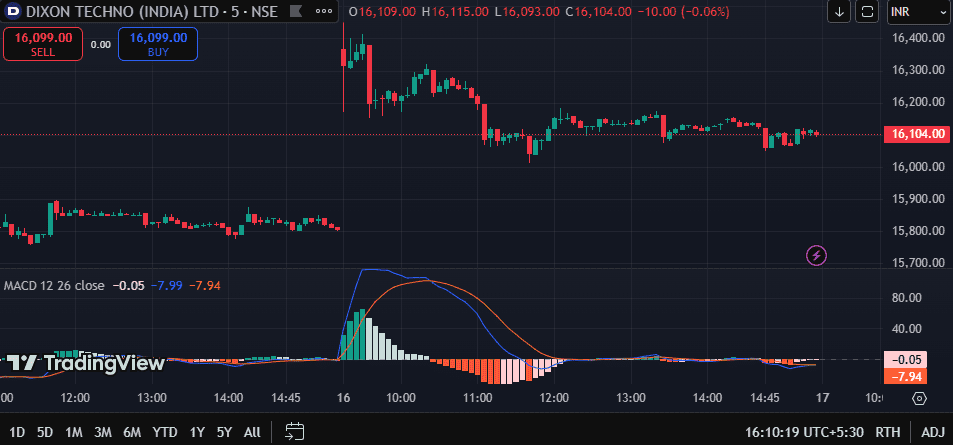
This momentum oscillator intraday trading takes the difference between the 12-period and 26-period EMAs. A 9-period EMA of this difference forms the signal line.
If MACD crosses above the signal line, it shows a bullish signal. But if MACD is crossing below the signal line, it means there is a bearish shift. Also, price creates new highs but MACD peaks lower momentum breakdown for divergence. Traders use this to gauge possible trend reversals or fading momentum.
4. Intraday Momentum Index (IMI)
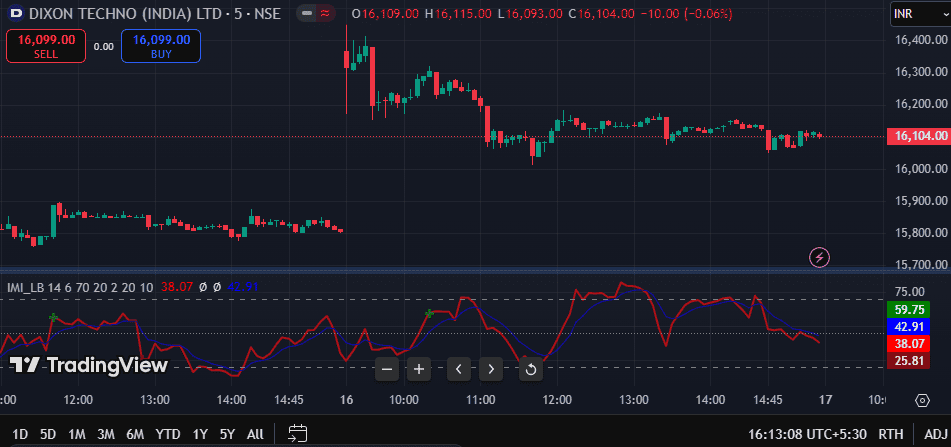
It uses RSI logic and candlestick analysis together. Intraday Momentum Index (IMI) is built for short-timeframe charts. Traders can use this momentum oscillator intraday trading to predict when a stock is overbought or oversold.
IMI = ( (∑ Gains) / (∑ Gains + ∑ Losses) ) × 100
Gains = CP − OP, on up days (when Close > Open)
Losses = OP − CP, on down days (when Open > Close)
CP = Closing Price
OP = Opening Price
n = Number of days (commonly 14)
So over 14 days:
- Add all Gains from the days when CP > OP
- Add all Losses from the days when OP > CP
- Plug them into the formula above
Momentum oscillator trading strategies
In momentum oscillator intraday trading, strategies are built around how price reacts with RSI, Stochastic, MACD, or IMI.
- Bullish divergence: Price hits new low, oscillator holds higher
- Bearish divergence: Price rises, oscillator flattens or dips
- Double confirmation: Use two oscillators showing same signal
- Wait for the turn: Don’t enter on extremes and wait for the oscillator to reverse
- Pair with price zones: Combine oscillator signals with support or resistance
Divergence strategy
Divergence occurs when the price and the indicator are not moving in the same direction. If the price makes a higher high but the oscillator doesn’t, it could mean the uptrend is losing strength. That’s a possible sell signal. If the price drops lower but the indicator starts to rise, it may signal a bounce.
Overbought and oversold strategy
Intraday traders use this method because it’s fast to spot and works well in sideways markets. Here are the overbought and oversold strategies you can follow:
- RSI above 70: Look for reversal signs to short
- RSI below 30: Watch for bounce signals to go long
- Stochastic above 80 or below 20: Ideal for short-term trades
- IMI above 70 or under 30: Best for intraday reversals
- Confirm with candles: Use price rejection at key levels before entering
Common mistakes to avoid with momentum oscillators
1. Using momentum oscillators in isolation
Trading with just RSI, Stochastic, or any other oscillator on its own can make you face losses. These tools show shifts in price pressure, but not why it’s happening. Without support from price action, volume, or broader trend analysis, signals often misfire.
2. Overemphasis on overbought/oversold levels
In strong trends, oscillators can stick in overbought or oversold zones for a while. Jumping in just because a level is breached can lead to trades that go the other way.
3. Ignoring the prevailing market trend
In trending markets, oscillators lose grip. If you’re trading intraday without reading the trend first, even solid signals can fail. If price is clearly trending, wait for pullbacks or confirmation and not reversal signs.
4. Neglecting divergence confirmation
Price and oscillator going separate ways should get your attention, but it’s not a trade trigger by itself. Use volume, structure, or a second indicator to understand false divergence signals.
Pros and cons of momentum oscillators in intraday
Pros
- RSI and Stochastic often call out trade spots with sharp overbought and oversold signals. For intraday setups, this helps time entries and exits.
- When price keeps rising but momentum slows, oscillators show divergence.
- If the price is trending or stuck in a range, oscillators still work. You just need to do trend-following in breakouts.
- The indicators are visual and don’t need complex math to read, which makes them beginner-friendly.
Cons
- Oscillators can show false readings if the market is too volatile.
- These tools rely on past data. So by the time the oscillator moves, the price may have already gone.
- Oscillators don’t account for news, earnings, or macro events. If you’re trading based only on indicators during such moves, you can expect false values.
- Some charts need shorter settings while others need longer. Tuning your indicator to match volatility is important.
When not to use a momentum oscillator
Traders must not use momentum oscillators in sideways markets. Its signals often flip fast with no real follow-through. Also, one must skip oscillator signals during strong trends without price confirmation.
Moreover, prices can stay extreme longer than expected. Hence, wait for the oscillator to turn before acting. Use them with trendlines, volume, or price zones to avoid false signals.
Conclusion
Momentum oscillator intraday trading tools like RSI, Stochastic, MACD, and IMI can help you read price pressure. But don’t make them your only guide. In a volatile market, these indicators might not show true values for hours and you won’t be able to get an entry. Rather than reacting to every signal, use them with price action, volume, or structure.
FAQs
For momentum oscillator intraday trading, RSI and Stochastic are top picks. They give clear overbought or oversold signals. For trend confirmation, MACD works well too. Intraday traders prefer tools that respond quickly to price moves.
RSI works well on 5-minute charts, but lower timeframes can increase signal noise. Many intraday traders use RSI 7 or RSI 9 on 5-minute candles for faster signals. Always use it with volume or price structure to avoid poor entries.
A 5-minute and 15-minute chart are common for intraday traders. Scalpers prefer 1-minute setups. For confirmation, use higher timeframes like 30-minute or hourly. Match the oscillator setting with your trading speed and the stock’s price behavior.
Momentum oscillators help time trades, but they’re not always right. They work better in range-bound sessions. In strong trends or high volatility, signals may mislead. Accuracy improves when combined with price action, support-resistance levels, and volume cues.
Traders can use oscillators with support-resistance zones, candlestick patterns, or volume spikes. For example, use RSI near a key level or combine MACD with moving averages. Don’t act on the indicator alone and make a confirmation with the current market prices.