You see a strong green candle, enter a buy trade, and within minutes the market reverses and hits your stop loss. This is a common intraday trading mistake that happens when traders focus only on candle colour instead of candlestick patterns and price location. This is why traders try to understand which candle is best for intraday trading, as the right candlestick pattern can help identify better entry points, reversals, and trend continuation during the trading day. In fact, data from the Securities and Exchange Board of India shows that about one in three equity cash traders do intraday, yet 71% lose money. This highlights the importance of properly understanding candlestick patterns and how to use them correctly in intraday trading.
What Are Candlestick Patterns in Trading?
Candlestick chart patterns are visual formations created using open, high, low, and close prices within a specific time frame. Each candle represents price activity for that period.
The body shows the difference between the opening and closing prices, while the wicks indicate the highest and lowest levels reached. Multiple candles together form patterns that help interpret price behaviour during a session
Why Candlestick Patterns Are Important in Intraday Trading
Candlestick patterns help interpret short-term price movement during a single trading session. They pinpoint areas where price reacts, pauses, or reverses based on buying and selling activity.
In intraday trading, quick decision-making is required, so simple patterns like single or two-candle formations are commonly used as they form faster and are easier to identify.
Best Candlestick Patterns for Intraday Trading
Some candlestick patterns are more commonly used in intraday trading because they form quickly and provide clear signals near important price levels.
Bullish Engulfing Candle for Intraday Trading
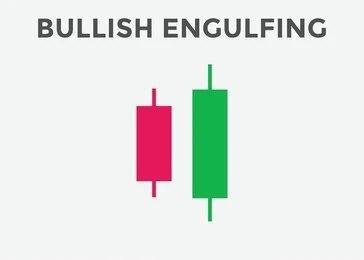
A bullish engulfing pattern forms when a green candle completely covers the previous red candle. It usually appears after a price decline and reflects strong buying activity. It is commonly observed near support levels where buyers start dominating.
Bearish Engulfing Candle for Intraday Trading
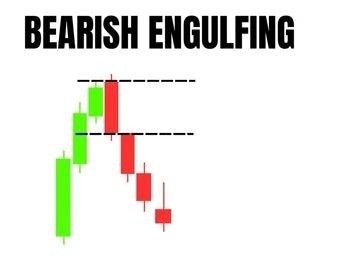
A bearish engulfing pattern forms when a red candle fully covers the previous green candle. It appears after a price rise and reflects increased selling activity. It is often seen near resistance levels.
Doji Candle for Intraday Reversal Signals
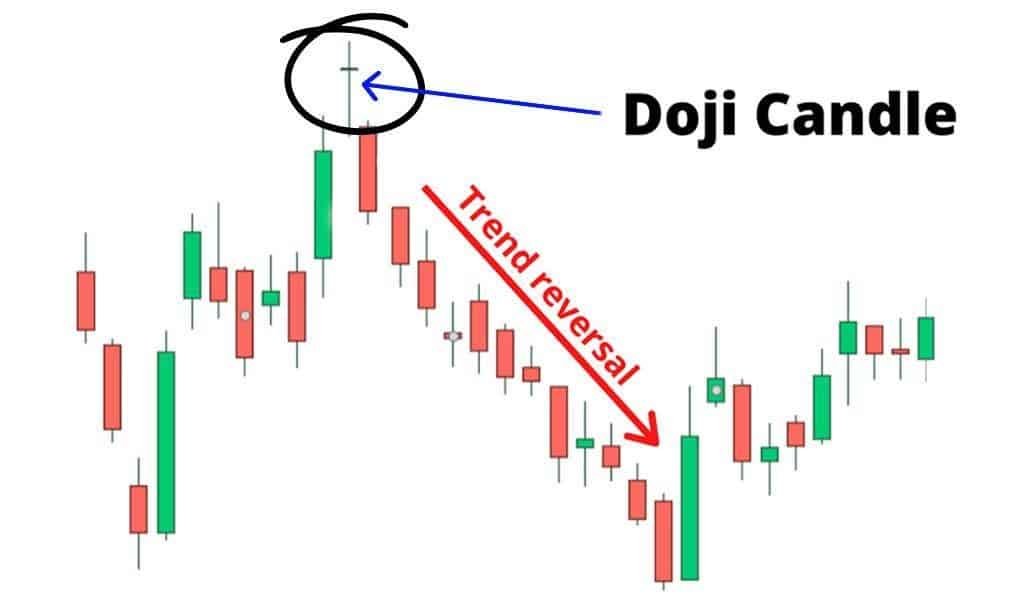
A doji candlestick pattern has a very small body candle, where the open and close prices are almost equal. It shows a balance between buyers and sellers. It is often observed before a price reversal or during sideways movement.
Hammer Candle for Intraday Buy Signals
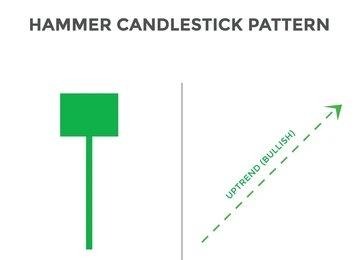
A hammer candlestick pattern consists of a candle which is made up of a small body with a long lower wick. It forms after a price decline and shows that lower prices were rejected. It is commonly used near support levels.
Shooting Star Candle for Intraday Sell Signals

A shooting star pattern has a small body with a long upper wick. It appears after a price rise and shows rejection of higher prices. It is often seen near resistance levels.
Marubozu Candle for Strong Trend Trading
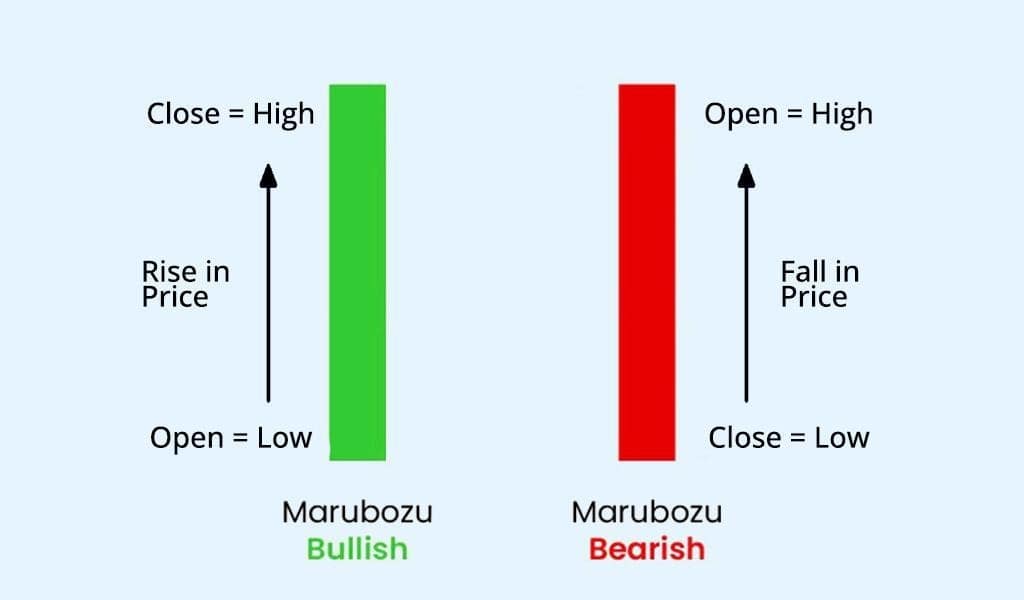
A marubozu candle has a large body with little or no wicks. It indicates strong buying or selling pressure throughout the session. It is generally used in strong directional moves.
Which Candlestick Pattern Works Best in Different Market Conditions
Different patterns are used depending on how the price is moving:
- In rising markets, bearish patterns near resistance are observed
- In falling markets, bullish patterns near support are observed
- In sideways markets, doji and inside candles are more common
- In strong moves, marubozu candles are often seen
Patterns are more relevant when they form at key price levels rather than randomly.
Best Timeframe to Use Intraday Candlestick Patterns
Traders commonly use short intraday timeframes such as:
- 5-minute charts for frequent signals
- 15-minute charts for clearer structure
- 1-hour charts for broader context
Shorter timeframes provide more signals, while slightly longer ones give more clarity.
How to Confirm Candlestick Signals Using Indicators
Candlestick patterns are often combined with indicators for confirmation. Common combinations include:
- RSI indicator to identify overbought or oversold zones
- Moving averages to identify direction
- VWAP to understand average price levels
A pattern supported by indicators is generally considered more reliable.
Combining Candlestick Patterns with Volume Analysis
Volume trading strategy helps in understanding the strength behind a candlestick pattern by showing how many market participants are involved in a price move. A pattern supported by strong volume usually reflects higher participation, while low volume may indicate limited interest. High volume during engulfing or reversal candles often reflects stronger conviction from buyers or sellers. On the other hand, patterns formed on low volume may not sustain further price movement.
Sudden volume spikes near support or resistance levels highlight increased activity and possible reaction zones. Volume also acts as a confirmation tool, helping filter weaker signals. Candlestick patterns are considered more reliable when supported by volume, as it reflects the intensity behind price action rather than just the visual formation.
Step-by-Step Intraday Strategy Using Candlestick Patterns
A properly laid-out approach that helps use candlestick patterns more effectively during intraday trading, combining price levels, confirmation, and execution. The steps are as follows:
- Identify key support and resistance levels: Mark important price zones where price has reacted earlier, as patterns are more relevant near these levels.
- Select an appropriate timeframe: Use short timeframes like 5-minute or 15-minute charts for clearer intraday setups.
- Wait for price to approach key levels: Observe how price behaves near support or resistance before looking for any pattern.
- Look for a candlestick pattern formation: Identify patterns like engulfing, hammer, or shooting star at those levels.
- Confirm the signal: Use volume, indicators, or the next candle to validate the pattern.
- Plan entry and stop-loss: Define entry near the pattern and place stop-loss at logical levels like recent highs or lows.
- Manage the trade actively: Monitor price movement and exit based on predefined targets or changing price behaviour.
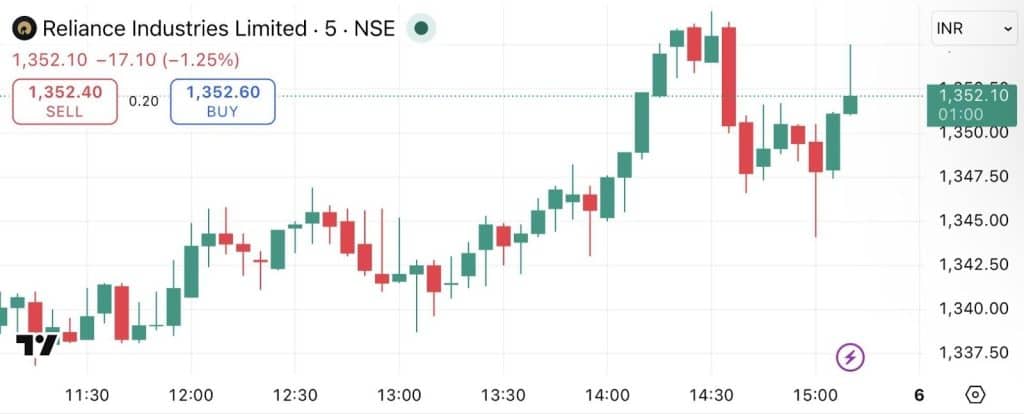
To see these steps in action, observe the Reliance Industries Limited (5-minute chart) from April 2, 2026, shown below. After a strong midday rally, a Bearish Engulfing pattern formed near the session high of 1,358, where a large red candle completely overwhelmed the previous green one. This clear reversal signal at a resistance level provided the perfect intraday entry, leading to the steady decline toward 1,352 by the market close.
Risk Management While Using Candlestick Patterns
Risk management is an essential part of intraday trading as price movements can change quickly within a single session. The key practices are as follows:
- Setting stop-loss at logical levels: Stop-loss strategy is often placed near recent highs or lows, helping define risk clearly and limit losses if price moves against the setup
- Waiting for confirmation before entry: Entering trades only after confirmation from indicators or volume reduces the chances of acting on weak signals
- Managing position size carefully: Allocating a fixed portion of capital per trade helps control overall exposure and avoids large losses from a single trade
- Avoiding overtrading during the session: Limiting the number of trades prevents unnecessary entries based on unclear patterns
Candlestick patterns are visual tools, but outcomes depend on how risk is managed alongside them.
Common Mistakes Traders Make Using Candlestick Patterns
The common mistakes to be aware of when using the candlestick patterns are as follows:
- Ignoring support and resistance levels: Patterns formed away from key levels often lack relevance, as price reactions are more meaningful near important zones.
- Neglecting volume confirmation: Volume reflects participation, and patterns without volume support may lead to weak or false signals.
- Over-dependence on single patterns: Using a single candlestick without a broader context can lead to an incorrect interpretation of price movement.
- Using too many patterns at once: Tracking multiple patterns can create confusion instead of clarity in decision-making.
- Ignoring overall price structure: Patterns work better when aligned with market structure and recent price behaviour rather than being used in isolation.
Which Candlestick Pattern Is Most Reliable for Intraday Trading
There is no single answer to which candle is best for intraday trading, as reliability depends on how patterns are used within the price context. The commonly observed patterns include:
- Engulfing patterns near core levels: Bullish and bearish engulfing candles reflect strong price movement when formed at support or resistance.
- Hammer and shooting star formations: These patterns indicate rejection of price and are often used near important levels for short-term setups.
- Marubozu candles in strong moves: These candles reflect continuous buying or selling pressure and are observed during strong directional movement.
- Doji candles in consolidation phases: Doji candles reflect a balance between buyers and sellers and are often seen before a price reaction.
Reliability improves when these patterns are supported by volume, indicators, and key price levels instead of being used alone.
Conclusion
Intraday trading is less about spotting a perfect candle and more about reading what the market is communicating through price. Knowing which candle is best for intraday trading comes from observing how patterns behave around key levels. When combined with patience and a disciplined approach, these patterns offer a more consistent way to read short-term price movement.