Introduction
A news report recently outlined how only “1 out of 10 F&O traders make profit”. This is alarming since the Options trading community has grown by 500% in FY2022 from FY2019! Evidently, the workings of options can be overwhelming for beginners.
When faced with multiple options for a specific symbol and expiry date, how can you effectively evaluate and compare the prices and benefits of each call-and-put option? How can you ensure that you make an informed decision about which option to trade?
The answer is simple: use an options chain. An options chain is a handy tool that displays all the call and put options for a particular symbol and expiry date in a tabular form. It helps you to see the current market prices, volumes, open interests, and other important information about each option.
With an options chain, you can easily compare and contrast different options and choose the one that suits your trading strategy and risk appetite. An options chain is like a map that guides you through the intricacies of options trading and helps you navigate the path.
New entrants in options trading might find the options chain confusing. In this exploration, you can understand what an option chain is, its component, and how it works.
Though it is one of the coolest tricks to learn options trading, risk management and considerations while using it are crucial to understand. Let us start with the basic concepts of options.
Basics of options
Options are financial derivatives that are commonly used for speculation and hedging. Buying an options agreement/contract is a privilege with a right (not the requirement or obligation) to purchase or sell an underlying security at a prefixed price (called strike or exercise price) within a given timeframe.
The maximum potential losses for option buyers are limited to the extent of the amount paid for the premium. On the other hand, option sellers are exposed to unlimited losses. Factors influencing option prices include underlying asset price, volatility, expiry, etc.
You can engage in options trading with 2 kinds of options – Call and Put. A call option trader can rightfully buy the underlying security at the predetermined strike price before the contract expires. Conversely, a put option holder has the privilege to sell the underlying asset at the strike price before expiry.
Beginners should note that the complex world of options trading carries significant risk. Therefore, it is essential to understand the fundamentals and strategies before stepping into options trading.
What is an option chain?
An option chain is a detailed compilation of all available option contracts for a given asset (stock, index, currency, commodity). An options chain represents basic concepts of options in a dynamic and organised manner.
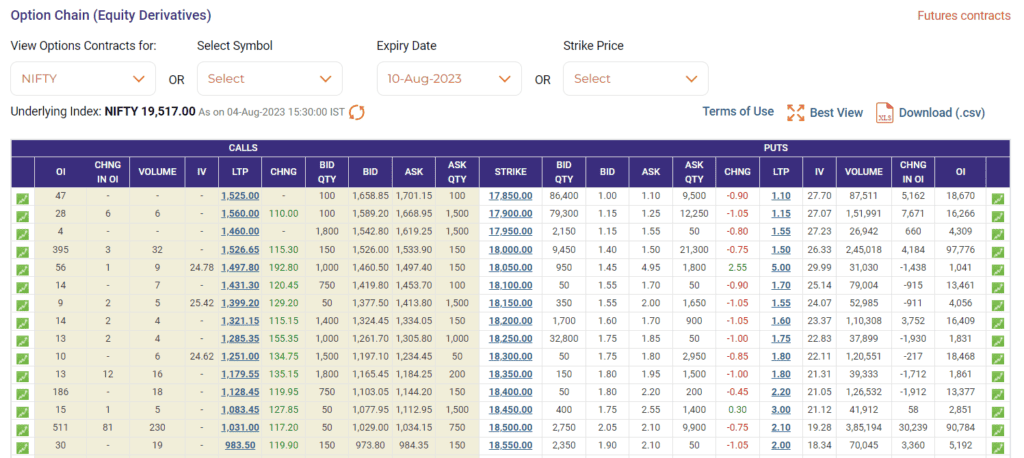
Typically displayed in a table format, it provides a snapshot of the strike price, expiry, volume, open interest, volatility, Greeks (like Delta, Gamma, and Theta), and other relevant details for available put options and call options.
Each row shows you different choices. It is like a clear map to decide what moves one can make in the derivatives market.
Here is a snapshot of the option chain:

Source: NSE
Components of an option chain
The terms listed in an options chain are self-explanatory. The components of an option chain are as follows:
Type of Options:
The options chain list call and put options with different strike prices and expires.
Strike Price:
You will spot a range of strike prices on the option chain. The strike price is the value at which the transaction takes place. If the option’s value crosses the strike price, the options trade can be an opportunity to make profits.
Expiries:
The options chain displays a list of expiries of contracts available for trading. Traders can check when the options contract becomes invalid if not exercised. The closer the expiry, the quicker your options lose their worth.
Last Traded Price (LTP):
Whichever price the screen shows as the last for an options contract is called as LTP.
Open Interest (OI):
Open interest represents how many option contracts are currently active for a specific strike price and expiry. These are the contracts that have not expired or been exercised so far. It also reflects the interest of different traders in a strike price.
Change in OI:
It indicates the change in the number of open contracts before the expiry date. The variation in the number of open contracts shows which contracts are closed, exercised, or squared off.
Bid and Ask Prices:
Bid price is easily the top most price which buyers are willing to offer for a contract. Conversely, the ask price is the base price or the minimum price a seller expects to receive in a sale.
Implied Volatility (IV):
Implied volatility indicates the potential price fluctuations in the price of an underlying asset.
Volume and Liquidity:
Volume refers to the number of a particular option contract traded in a market. It indicates the liquidity of a contract in the market. Higher volume indicates higher liquidity as more investors are interested in the underlying security.
Net Change:
It refers to the net change of the last traded price. If there is a positive change, it means a price rise. On the other hand, unfavourable changes imply a price decrease.
Bid Quantity:
This is the quantity of securities that buyers want to buy at a specific strike price. It indicates the current demand for the option at that price level.
Ask Quantity:
This is the quantity of securities that sellers are willing to sell at a specific strike price. It indicates the current supply of the option at that price level.
ATM, ITM, OTM:
This is a categorisation based on the underlying security’s price. These are At the Money (ATM), In the Money (ITM), and Out of the Money (OTM). ATM or ATM is simply when the strike price aligns or matches the market price of the underlying security.
Now, if the strike price of the option is below the market price, then it is ITM and if the option’s strike price is more than the underlying asset’s market price then it is OTM.
Greeks:
Greeks – Delta, Gamma, Theta, etc. measure an option’s sensitivity to changes in price, volatility, time decay, and more.
Now, you know the components of the option chain, but are you wondering how to interpret it? Let’s find out.
Interpreting option chain

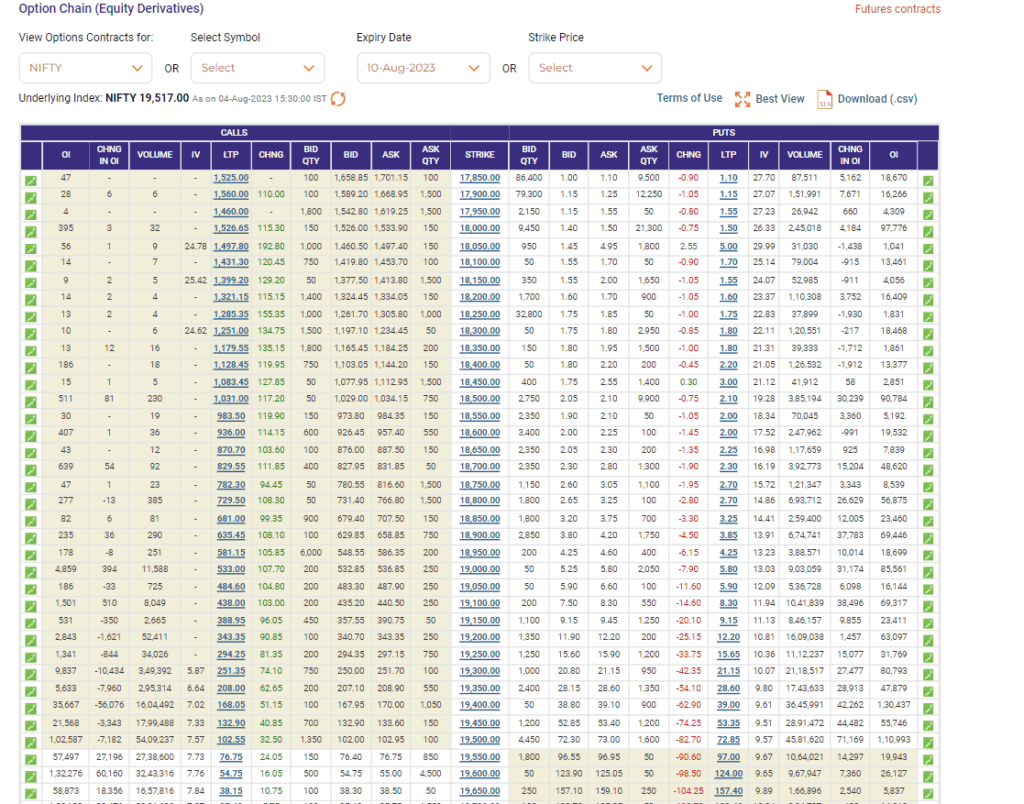
Source: NSE
You are looking at an option chain for Nifty, with different strike prices. Let’s see how to interpret the option chain in the given image.
The option chain chart has four quadrants: call options (yellow and white) and put options (yellow and white). The yellow section displays the data for the ITM contracts, and the white section shows the information for the OTM ones. This applies to both call and put options, but the definition of ITM and OTM is opposite for each type.
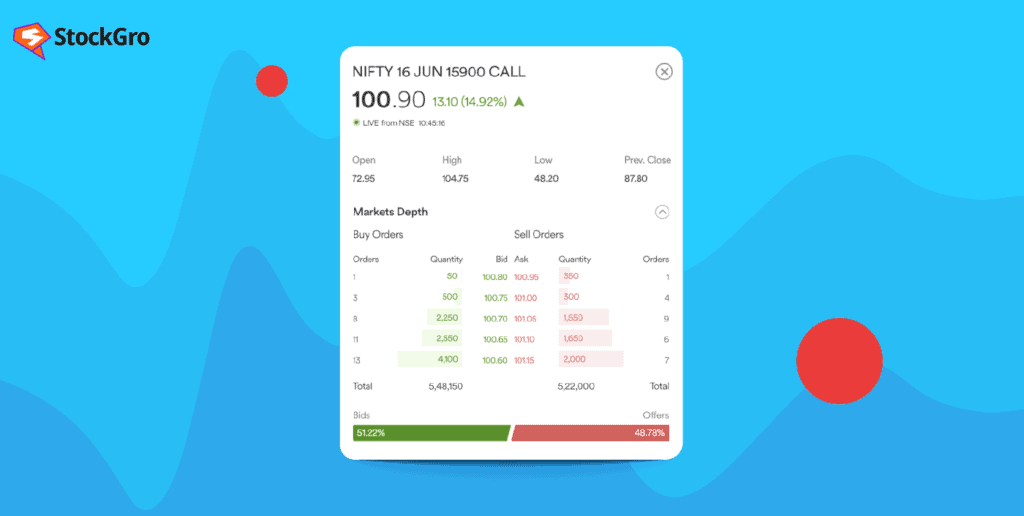
The option chain shows the trader how liquid and deep each specific strike is. Traders can access not only the records of the executed price but also the real-time bid and ask price, bid-ask quantity. This gives a clear picture of the depth and liquidity in each strike and overall.
The option chain can also alert the trader of sudden moves or breakouts in the underlying asset. This way, the trader can anticipate the volatility in the underlying asset beforehand.
Understanding the significance and uses of option chain
The option chain holds significant importance for options traders. It is a valuable tool providing insights, enabling traders to execute well-considered strategies. Key reasons why the option chain is essential for traders are as follows:
- Access to Trading Opportunities in One Place: As an option chain displays a comprehensive overview of all available options, you can quickly access varied strike prices, expiries and premiums for both call and put options. It allows traders to evaluate various stock options and trading opportunities in one place.
- Price Discovery: Traders can analyse prices (premiums) of options at various strike prices and expiries. These details aid in understanding market sentiment, determining expected price movements, and potential entry/exit points for trades.
- Risk Management: Option chain aids traders while evaluating the potential risks of various options strategies. They can tailor their trades and manage risk by comparing contracts at different strike prices and expiries. These risk management practices align investment objectives along with risk-taking capability.
- Understanding Market Sentiment: Open interest analysis at different strike prices helps traders to understand a security’s outlook – bullish, bearish, or neutral.
- Strategy Selection: Think of the option chain as pre-trade preparation. Traders can implement specific options trading strategies as it gives you all the data required. Whether it is about selling or buying options, creating spreads, or hedging positions to maximise gains or reduce risks, traders can have all the necessary data to select strategies aligned with your market outlook.
This way, an options chain is required to navigate the complexities of stock options trading and make well-informed decisions based on their goals and market insights.
Limitations of options chain data
While an options chain is a useful tool for traders, they should keep in mind its following limitations:
1. Limited Coverage: Options chains provide a picture of option prices at a specific point in time. As market conditions change constantly, the information in the options chain may quickly become outdated.
2. Complexity in Options Trading for Beginners: Interpreting options chains requires knowledge of fundamental concepts. Novices may find its learning curve complex. Misinterpreting the information available in an options chain can result in wrong trading decisions, leading to losses.
3. No Assurance of Execution: Traders can not be assured of buying and selling a contract at the displayed bid/ask prices just because it is listed in the options chain. As market conditions change rapidly, the actual trade execution price may vary.
4. Not the Only Substitute for Analysis: While an option chain provides most of the crucial data about contracts, they are just a part of the analysis process for trading. Options traders need to consider various other factors, like technical and fundamental analysis, before deciding on a position.
Wrap-Up
Despite a few limitations, options chains remain valuable tools for traders helping to assess market sentiment, evaluate potential trade opportunities and risks, and make well-informed decisions about options positions.
Traders need to use them in conjunction with other sources of information and their analysis of options and underlying assets.


Leave a Comment