
Do you follow the stock market regularly? How do you track the movement of different share prices? Well, stocks are subject to high degrees of fluctuations, and investors must constantly keep a check on each stock to determine how the market is performing. Sounds tedious, right?
Tracking the movement of each stock is nearly impossible. So, how do traders and investors track the market? That is where ratios and indicators come in handy. Today’s article deals with one such ratio, the advance-decline ratio, that helps assess the stock market performance as a whole.
What is the advance-decline ratio?
The advance-decline ratio is a mathematical ratio that compares the number of stocks with increasing prices, against the number of stocks with decreasing prices. The closing prices of stocks are compared to analyse the number of stocks rising versus the number of stocks declining.
Also read: Do all technical analysis tools work equally well?
Understanding advance-decline ratio
The advance-decline ratio is a technical analysis indicator that tells investors about the stock market’s direction.
Advances, in this context, refer to the count of stocks that have risen in price. Decline refers to the number of stocks whose prices are falling.
When today’s closing price of a stock is greater than its closing price on the previous day, the stock is said to have advanced.
For example, if the closing price of a stock on 01 Dec 2023 is ₹100 and 02 Dec 2023 is ₹102, the stock is advancing.
When today’s closing price of a stock is less than its closing price on the previous day, the stock is said to have declined.
For example, if the closing price of a stock on 01 Dec 2023 is ₹100 and 02 Dec 2023 is ₹98, the stock is declining.
When the numerator has a greater value, it suggests that more stocks are increasing in price, indicating a bullish market. In contrast, when the denominator is greater, the number of stocks reducing in price is higher, suggesting a bearish market.
Also read: Here’s how you can use the MACD indicator
How to calculate the advance-decline ratio?
Formula = Number of stocks advancing / Number of stocks declining
Number of stocks advancing or declining = Current day’s closing price – Previous day’s closing price.
The ratio is also flexible in terms of the area it covers and the duration – Investors can choose the sector and duration as required for their analysis.
Investors generally use the numbers calculated at regular intervals to plot them on a graph to create the advance decline ratio chart, that shows the strength of market trends.
To calculate the plots on the graph:
- Calculate net advances by deducting the declines from the number of advances. If the number of advances is high, this number is positive; else, it is negative. The net advance for the first period is the starting point on the graph.
- From the second point onwards, add the previous period’s index to the current net advance.
- Plot the points on the graph and join them to show the movement of prices. The direction suggests whether the market is bullish, bearish or indecisive.
Example
Consider the advance-decline ratio on NSE. The exchange publishes the advance-decline ratio on its website every day, considering all stocks listed on the National Stock Exchange.
Based on the numbers for November 2023, the advance-decline line looks like the below:
Date | Number of stocks advancing | Number of stocks declining | Ratio (Advancing / Declining) | AD Line [(Advance – Decline) + Previous AD point] |
| 01/11/2023 | 938 | 1,478 | 0.63 | -540 |
| 02/11/2023 | 1,670 | 753 | 2.22 | 377 |
| 03/11/2023 | 1,572 | 850 | 1.85 | 1,099 |
| 06/11/2023 | 1,635 | 807 | 2.03 | 1,927 |
| 07/11/2023 | 1,268 | 1,155 | 1.1 | 2,040 |
| 08/11/2023 | 1,344 | 1,072 | 1.25 | 2,312 |
| 09/11/2023 | 976 | 1,436 | 0.68 | 1,852 |
| 10/11/2023 | 1,263 | 1,150 | 1.1 | 1,956 |
| 12/11/2023 | 1,950 | 398 | 4.9 | 3,517 |
| 13/11/2023 | 924 | 1,505 | 0.61 | 2,936 |
| 15/11/2023 | 1,500 | 928 | 1.62 | 3,508 |
| 16/11/2023 | 1,223 | 1,216 | 1.01 | 3,515 |
| 17/11/2023 | 1,257 | 1,199 | 1.05 | 3,573 |
| 20/11/2023 | 1,156 | 1,326 | 0.87 | 3,403 |
| 21/11/2023 | 1,315 | 1,120 | 1.17 | 3,598 |
| 22/11/2023 | 1,007 | 1,455 | 0.69 | 3,150 |
| 23/11/2023 | 1,316 | 1,113 | 1.18 | 3,353 |
| 24/11/2023 | 1,128 | 1,294 | 0.87 | 3,187 |
| 28/11/2023 | 1,241 | 1,236 | 1 | 3,192 |
| 29/11/2023 | 1,283 | 1,171 | 1.1 | 3,304 |
| 30/11/2023 | 1,260 | 1,201 | 1.05 | 3,363 |
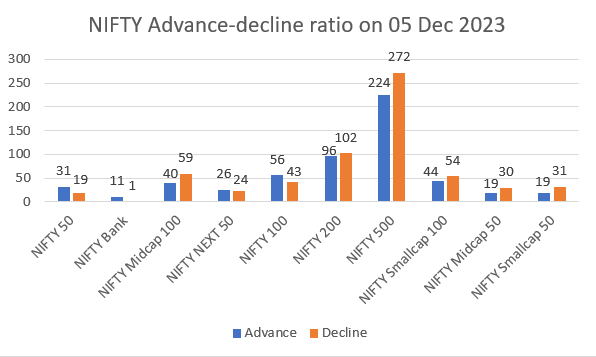
Below is the NIFTY advance-decline ratio chart as of 05 Dec 2023, showing the advances and declines of stocks in key NIFTY indices.
Also Read: Bullish engulfing candlestick pattern: Learn how to spot trend reversals
Pros and cons of advance-decline ratio
The advance-decline ratio is a simple, easy-to-use technical indicator that helps investors assess the stock market’s direction. As against other technical indicators like candlestick patterns and triangles, the advance-decline chart is straightforward.
The tool is flexible and can be altered to study an individual stock over a period of time, or a sector or the entire stock market, based on the investor’s purpose of analysis.
However, like every other technical analysis indicator, the advance-decline chart has its limitations, too. The chart provides surface-level information and is insufficient to formulate profitable trading strategies.
For example, the advance-decline chart of the NIFTY Pharma Index shows how the pharma stocks are performing in general. One stock may be highly fluctuating, whereas another might be stable. One stock might continuously advance, while another might be declining. Such specific information and the reasons for price changes are not available on the advance-decline chart.
Bottomline
The advance-decline ratio is one of the many tools available to technical traders in the stock market. It suggests how the market is trending, based on the number of stocks increasing and decreasing in price. The ratio is best used when combined with other strategic technical indicators. However, the advance-decline chart acts as a suitable tool to begin market analysis for novice investors.