
Financial markets carry high levels of risk due to fluctuating prices of securities. Despite that, investors prefer investing in it because the profits are equally attractive. Often, high-risk securities offer high returns, which is why investors go that extra mile in taking additional risks.
So, understanding the relationship between risk and return is crucial when choosing assets for investments. Various models help investors assess a security’s risk exposure and return rate. One such model is the CAPM (Capital Asset Pricing Model). The concepts of the security market line (SML) and the capital market line (CML) are extensions of this model.
In today’s article, let’s understand CML vs SML, along with the formula for the capital market line and security market line.
Understanding risks in investments
Risks in the financial market can be divided into two broad categories: Systematic and unsystematic.
Systematic risk includes macroeconomic factors that affect the market as a whole, for example, recession, fiscal policy changes, etc. Such systematic risk cannot be mitigated entirely.
Unsystematic risk is particular to one financial asset. For example, a company gets caught in fraudulent activities, which affects its stock price. Investors can mitigate these risks by holding a portfolio of diverse assets.
Since systematic risks cannot be controlled, investors must understand the impact of such risks on their returns. To analyse the effect of such risks, investors use models like the CAPM.
Also read: Stock market risk
What is the security market line?
The security market line uses the concept of CAPM to graphically represent the relationship between an investment instrument’s risk and return.
With expected risk and return on the X and Y-axis respectively, a slope is drawn to represent the market risk premium. The market risk premium is usually the difference between the expected rate of return and the risk-free rate of return (the minimum return an investor would receive on risky assets).
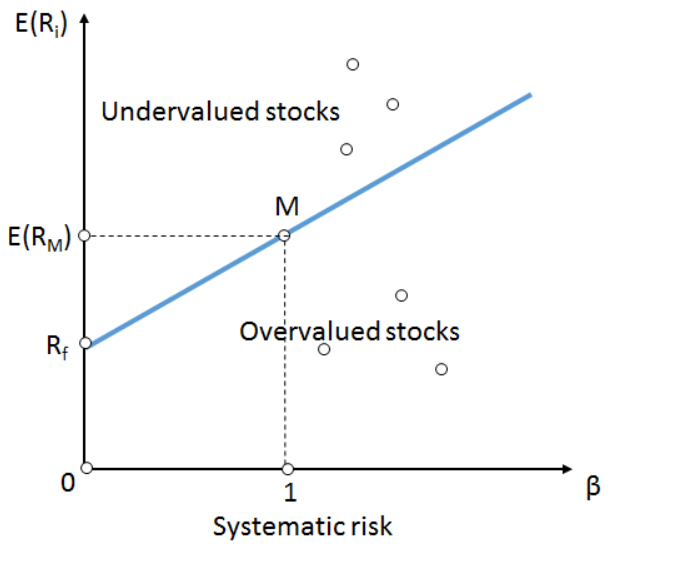
This slope is the SML. Assets falling above the slope represent undervalued securities whose returns are higher than the market for a given level of risk. Assets below the slope indicate overvalued securities whose returns are lower than the market at a given risk level.
So, based on where securities fall, investors can understand whether the risk and return match their expectations and make investment decisions accordingly.
What is the capital market line?
The capital market line conceptually is like the security market line and is a representation of the capital asset pricing model.
However, unlike the security market line, which represents the risk and return of an individual asset, the capital market line represents the same for a portfolio of assets.
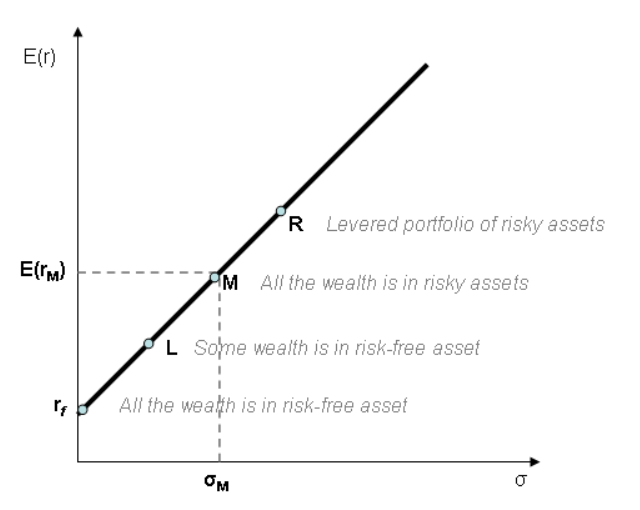
The capital market line suggests holding a combination of risk-free assets and market portfolios to get the optimum return for a given level of risk. Any portfolio that lies on the capital market line is said to be the most efficient one, offering the right balance between risk and return.
Also read: Capital asset pricing model
The differences between the capital market line and the security market line
Besides the differences in calculation and the factors involved, the security market line and capital market line differ from each other in these three aspects:
- The security market line focuses on a specific asset, whereas the capital market line focuses on a collection of assets.
- The objective of the security market line is to understand whether an asset is overvalued or undervalued and help investors analyse the risks involved, to make investment decisions. The capital market line aims to help investors build a well-balanced portfolio that has a combination of risky assets and risk-free assets.
- The security market line uses beta to measure risk, while the capital market line uses standard deviation to measure risk.
Bottomline
Despite various criticisms, the capital asset pricing model is widely used among investors to make investment decisions. The security market line and capital market line are extensions of this concept that help traders establish a relationship between risk and return.
While the security market line talks about the risk and return levels of an individual asset, the capital market line focuses on the risk and return of a portfolio. To choose the right assets for investments, and to maintain a well-balanced portfolio with maximum returns and minimum risks, these lines play a significant role. Hence, understanding the formation and indication of these lines is crucial.