Investing requires a keen understanding of the risks associated with each decision. The security market line (SML), a fundamental aspect of the capital asset pricing model (CAPM), serves this purpose effectively. It’s a concept that provides a visual assessment of an investment’s risk in relation to its expected return.
The SML evaluates the risk-reward ratio of stocks. This ratio is often underestimated, yet it’s vital for making informed decisions. A thorough understanding of the SML can prevent situations where you might take on too much risk for a small gain or, conversely, too little risk for a potentially larger reward.
This article will introduce you to the basics of the security market line, how it’s calculated, and its significance in evaluating investments.
You may also like: How to pick winning stocks with quantitative analysis: A beginner’s guide
What is security market line?
In finance, risk is categorised into two main types: systematic and unsystematic. Systemic risk or market risk, is a form of risk that cannot be mitigated by diversification and impacts the whole market. This includes factors like interest rate changes and macroeconomic events. On the other hand, unsystematic risk is unique to each security and can be reduced by portfolio diversification.
CAPM emphasis on the link between expected return and systematic risk. This model underscores that systematic risk, being inherent to the market, impacts the potential returns investors can expect from their investments.
In this context, the security market line becomes a crucial tool. It’s a visual depiction of the CAPM.
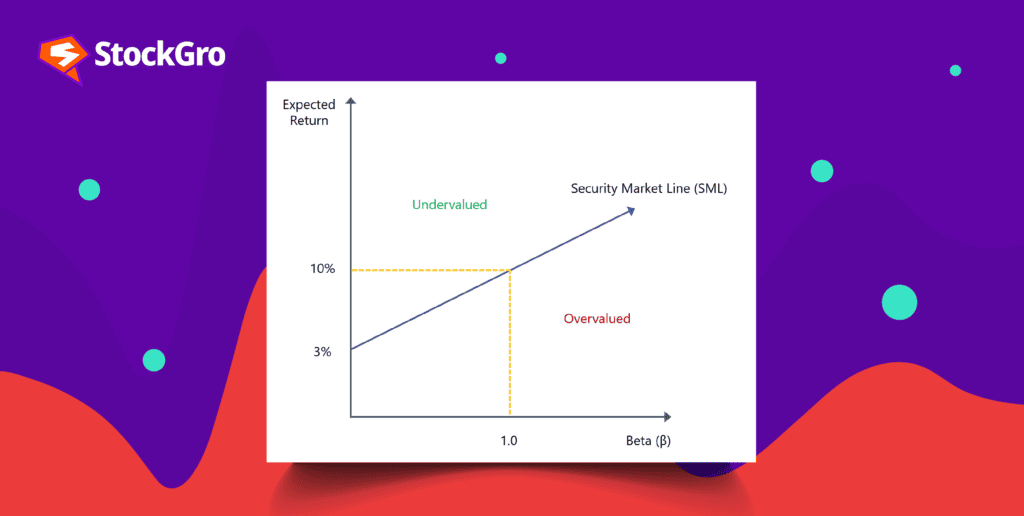
On a chart, the SML uses two axes: the x-axis shows the asset’s risk (measured by beta), and the y-axis displays its expected return. This line, also known as the characteristic line, helps in evaluating whether securities are valued appropriately in the market.
Securities lying above the SML are considered undervalued, as their expected return is higher than what CAPM suggests for their level of risk. Conversely, those below the SML are viewed as overpriced, offering lower returns than warranted by their risk.
Also read: Key risks in investing in the stock market
Assumptions of SML
As a component of the CAPM, the SML is predicated on certain assumptions. They are as follows:
- Investors in the market are price takers and cannot influence the price of securities.
- All investors have the same investment timeframe.
- Short selling is not possible in this model.
- Trading has no related taxes or transaction fees.
- The model includes a single risk-free asset for comparison.
- The market offers a wide range of risky assets.
- All market participants are assumed to act rationally, making decisions to maximise returns.
Understanding the security market line equation
The security market line formula is fundamental in finance for linking an investment’s risk to its expected return. This equation is central to understanding how different investments are evaluated within the CAPM.
E(Ri) = Rf + βi [E(Rm) — Rf]
Let’s break down each component:
- E(Ri)- Expected return of the investment: This is what investors aim to find out – the possible return on investment that they can anticipate.
- Rf – Risk-free rate: This represents the return on risk-free investments. It’s the baseline return you would get without taking any market risk.
- βi (Beta): It calculates an investment’s systemic risk in relation to the market as a whole. If an investment’s beta value is 1, then its risk is equivalent to that of the market. Investments are riskier than the market if beta is more than 1, and less risky if beta is less than 1.
- E(Rm) – Expected Market Return: This represents the market’s total expected return.
- (E(Rm) – Rf) – Equity risk premium (ERP) : This is the extra return that is anticipated when assuming higher risks as opposed to making an investment that is risk-free.
The slope of SML
The slope of the security market line is directly influenced by investors’ expectations about risk and the return they require as compensation for that risk. The investors’ degree of risk aversion is correlated with the SML’s steepness.
If investors are more risk-averse, the SML will be steeper, indicating they demand higher returns for taking on additional risk. Conversely, with less risk-averse investors, the SML is less steep, as they require lower additional returns for increased risk levels.
Limitations of security market line
- Risk-free Rate variability: The risk-free rate, often based on short-term government securities, can fluctuate over time. These changes can introduce volatility and affect the reliability of the SML.
- Dependence on market returns: The market return used in the SML is measured from past results, which may not always be indicative of future performance. This reliance on historical data can limit the SML’s predictive ability.
- Changing market conditions: Factors like GDP growth, inflation, interest rates, and unemployment can cause the beta coefficient and the market risk premium to change, affecting the SML’s accuracy.
- Forecasting beta: Predicting the beta coefficient accurately is challenging. Inaccurate assumptions in calculating beta can lead to unreliable predictions of returns using the SML.
Capital market line and security market line differences
The capital market line (CML) is a graphical representation showing the best possible risk-return balance for a portfolio of investments, including both risky assets and a risk-free asset. Let’s now compare the CML with the SML.
| Aspect | SML | CML |
| Focus | Focuses on specific assets, such as equities. | Concentrates on portfolios that include assets that are both risky and risk-free. |
| Risk measure | Uses beta to measure systematic risk of individual assets. | Employs standard deviation to measure the total risk (systematic and unsystematic) of portfolios. |
| Risk considered | Only systematic risk. | Systematic risks and unsystematic risks. |
| Representation | Reflects all market portfolios, regardless of their level of efficiency. | Depicts only efficient portfolios. |
| Equation | E(Ri)=Rf+βi[E(Rm)−Rf] | E(Rp)=Rf+[[E(Rm)−Rf] / σm ]×σp |
| Application | Used for asset valuation and selection based on risk. | Utilised for optimising portfolios, balancing risk and return. |
| Parameters | Focuses on systematic risk (beta). | Considers diversification and the risk-free rate. |
Also read: Risk management in stock market
Security Market Line Formula
The Security Market Line (SML) represents the relationship between expected return and systematic risk in the Capital Asset Pricing Model (CAPM). It helps investors determine whether a stock is fairly valued based on its risk.
The formula for the Security Market Line is:

Where:
- Rf = Risk-free rate
- β (Beta) = Systematic risk of the asset
- Rm = Expected market return
- (Rm − Rf) = Market risk premium
For example, if:
- Risk-free rate = 6%
- Market return = 12%
- Beta of stock = 1.2
Expected return = 6% + 1.2 × (12% − 6%)
= 6% + 1.2 × 6%
= 6% + 7.2%
= 13.2%
If a stock offers more than 13.2%, it may be undervalued. If it offers less, it may be overvalued.
Capital Market Line Vs Security Market Line
The Capital Market Line (CML) and Security Market Line (SML) both come from CAPM, but they measure different types of risk.
- CML measures total risk (standard deviation).
- SML measures systematic risk (beta).
CML applies only to efficient portfolios that combine the market portfolio and risk-free asset. SML applies to individual securities as well as portfolios.
In simple terms:
CML is for portfolios and total volatility.
SML is for individual assets and market risk.
Security Market Line Risk Measure
The SML uses beta (β) as its risk measure.
Beta measures how sensitive a stock is compared to the overall market.
- Beta = 1 → Moves with the market
- Beta > 1 → More volatile than the market
- Beta < 1 → Less volatile than the market
Since SML focuses only on systematic risk (market risk), it assumes that unsystematic risk can be diversified away.
Final thoughts
SML is a key financial tool that shows the CAPM graphically. It facilitates investors to assess the expected returns of assets in relation to their risks. When making investment decisions, it’s important to use the SML to evaluate whether a security’s potential return aligns with your risk tolerance, ensuring a well-informed approach to balancing risk and reward in your investment portfolio.
FAQ’s
The slope of the Security Market Line is the market risk premium, which is calculated as (Market Return − Risk-Free Rate). It represents the additional return investors demand for taking market risk.
The Security Market Line depicts the relationship between expected return and systematic risk (beta). It shows whether a security is fairly valued based on its risk level.